Immigrants from Thailand vs Immigrants from Scotland Cognitive Disability
COMPARE
Immigrants from Thailand
Immigrants from Scotland
Cognitive Disability
Cognitive Disability Comparison
Immigrants from Thailand
Immigrants from Scotland
17.9%
COGNITIVE DISABILITY
0.8/ 100
METRIC RATING
246th/ 347
METRIC RANK
16.2%
COGNITIVE DISABILITY
100.0/ 100
METRIC RATING
10th/ 347
METRIC RANK
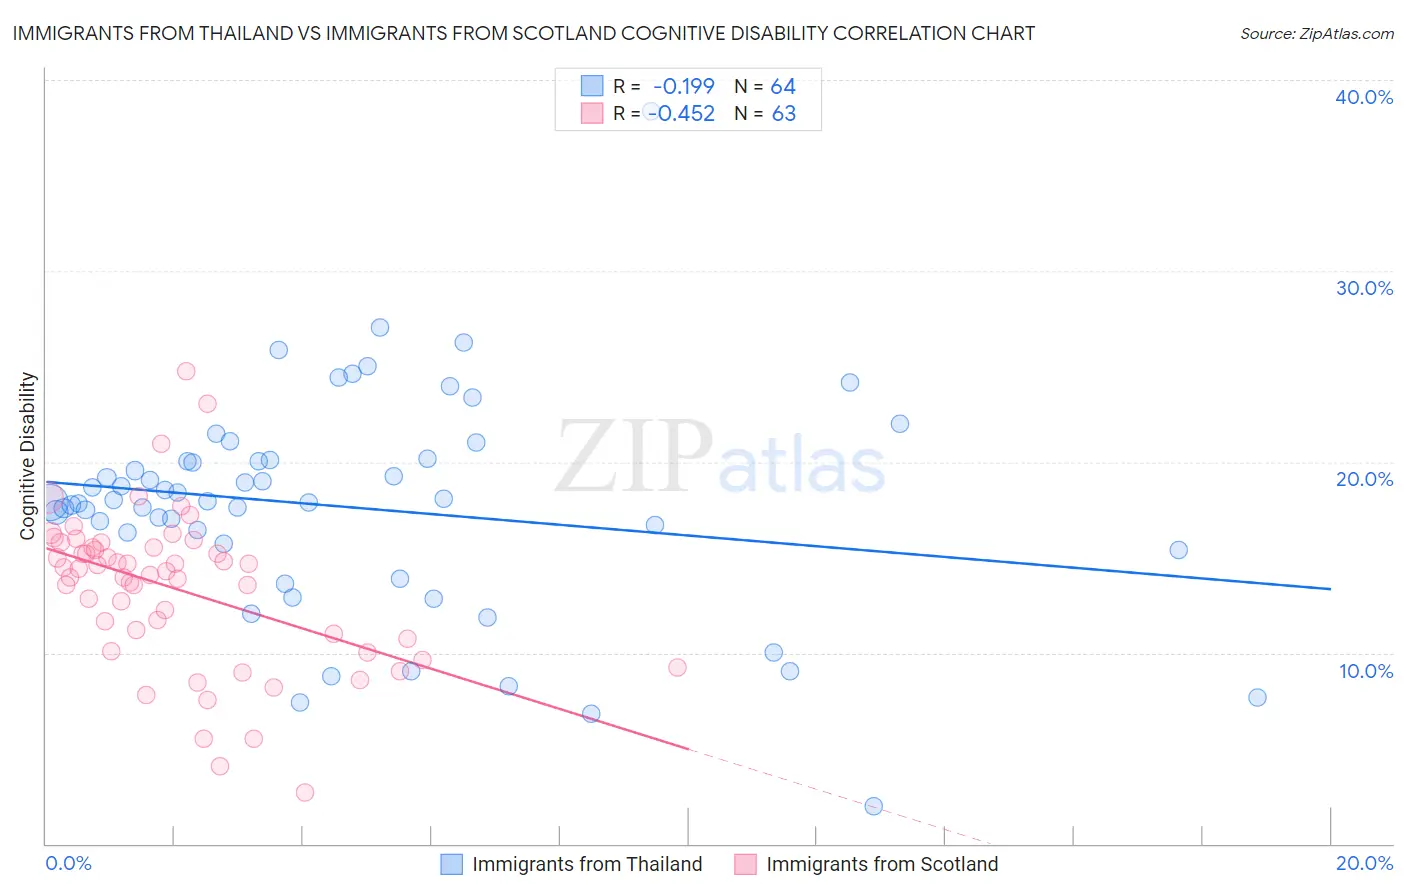
Immigrants from Thailand vs Immigrants from Scotland Cognitive Disability Correlation Chart
The statistical analysis conducted on geographies consisting of 316,987,546 people shows a poor negative correlation between the proportion of Immigrants from Thailand and percentage of population with cognitive disability in the United States with a correlation coefficient (R) of -0.199 and weighted average of 17.9%. Similarly, the statistical analysis conducted on geographies consisting of 196,398,604 people shows a moderate negative correlation between the proportion of Immigrants from Scotland and percentage of population with cognitive disability in the United States with a correlation coefficient (R) of -0.452 and weighted average of 16.2%, a difference of 10.3%.
Cognitive Disability Correlation Summary
| Measurement | Immigrants from Thailand | Immigrants from Scotland |
| Minimum | 2.0% | 2.7% |
| Maximum | 38.4% | 24.7% |
| Range | 36.4% | 22.0% |
| Mean | 17.6% | 13.3% |
| Median | 17.9% | 14.3% |
| Interquartile 25% (IQ1) | 15.5% | 10.7% |
| Interquartile 75% (IQ3) | 20.1% | 15.5% |
| Interquartile Range (IQR) | 4.5% | 4.8% |
| Standard Deviation (Sample) | 5.8% | 4.1% |
| Standard Deviation (Population) | 5.8% | 4.1% |
Similar Demographics by Cognitive Disability
Demographics Similar to Immigrants from Thailand by Cognitive Disability
In terms of cognitive disability, the demographic groups most similar to Immigrants from Thailand are Trinidadian and Tobagonian (17.9%, a difference of 0.020%), Samoan (17.9%, a difference of 0.070%), French American Indian (17.9%, a difference of 0.080%), Jamaican (17.9%, a difference of 0.12%), and Cree (17.9%, a difference of 0.13%).
| Demographics | Rating | Rank | Cognitive Disability |
| Cajuns | 1.4 /100 | #239 | Tragic 17.8% |
| Iraqis | 1.4 /100 | #240 | Tragic 17.8% |
| Mexicans | 1.1 /100 | #241 | Tragic 17.8% |
| Paiute | 1.1 /100 | #242 | Tragic 17.8% |
| Immigrants | Bangladesh | 1.0 /100 | #243 | Tragic 17.8% |
| Jamaicans | 0.9 /100 | #244 | Tragic 17.9% |
| Trinidadians and Tobagonians | 0.8 /100 | #245 | Tragic 17.9% |
| Immigrants | Thailand | 0.8 /100 | #246 | Tragic 17.9% |
| Samoans | 0.7 /100 | #247 | Tragic 17.9% |
| French American Indians | 0.7 /100 | #248 | Tragic 17.9% |
| Cree | 0.7 /100 | #249 | Tragic 17.9% |
| Immigrants | Ethiopia | 0.7 /100 | #250 | Tragic 17.9% |
| Malaysians | 0.6 /100 | #251 | Tragic 17.9% |
| Immigrants | Grenada | 0.6 /100 | #252 | Tragic 17.9% |
| Hopi | 0.6 /100 | #253 | Tragic 17.9% |
Demographics Similar to Immigrants from Scotland by Cognitive Disability
In terms of cognitive disability, the demographic groups most similar to Immigrants from Scotland are Assyrian/Chaldean/Syriac (16.2%, a difference of 0.040%), Immigrants from Czechoslovakia (16.2%, a difference of 0.080%), Maltese (16.2%, a difference of 0.25%), Lithuanian (16.3%, a difference of 0.34%), and Immigrants from Poland (16.1%, a difference of 0.36%).
| Demographics | Rating | Rank | Cognitive Disability |
| Chinese | 100.0 /100 | #3 | Exceptional 15.9% |
| Immigrants | Lithuania | 100.0 /100 | #4 | Exceptional 16.0% |
| Immigrants | Hong Kong | 100.0 /100 | #5 | Exceptional 16.0% |
| Thais | 100.0 /100 | #6 | Exceptional 16.1% |
| Immigrants | Ireland | 100.0 /100 | #7 | Exceptional 16.1% |
| Immigrants | Poland | 100.0 /100 | #8 | Exceptional 16.1% |
| Assyrians/Chaldeans/Syriacs | 100.0 /100 | #9 | Exceptional 16.2% |
| Immigrants | Scotland | 100.0 /100 | #10 | Exceptional 16.2% |
| Immigrants | Czechoslovakia | 100.0 /100 | #11 | Exceptional 16.2% |
| Maltese | 100.0 /100 | #12 | Exceptional 16.2% |
| Lithuanians | 100.0 /100 | #13 | Exceptional 16.3% |
| Immigrants | Austria | 100.0 /100 | #14 | Exceptional 16.3% |
| Immigrants | Greece | 100.0 /100 | #15 | Exceptional 16.3% |
| Eastern Europeans | 100.0 /100 | #16 | Exceptional 16.3% |
| Immigrants | North Macedonia | 100.0 /100 | #17 | Exceptional 16.3% |