Spaniard vs Immigrants from Eastern Asia Cognitive Disability
COMPARE
Spaniard
Immigrants from Eastern Asia
Cognitive Disability
Cognitive Disability Comparison
Spaniards
Immigrants from Eastern Asia
17.3%
COGNITIVE DISABILITY
40.3/ 100
METRIC RATING
183rd/ 347
METRIC RANK
16.8%
COGNITIVE DISABILITY
97.9/ 100
METRIC RATING
105th/ 347
METRIC RANK
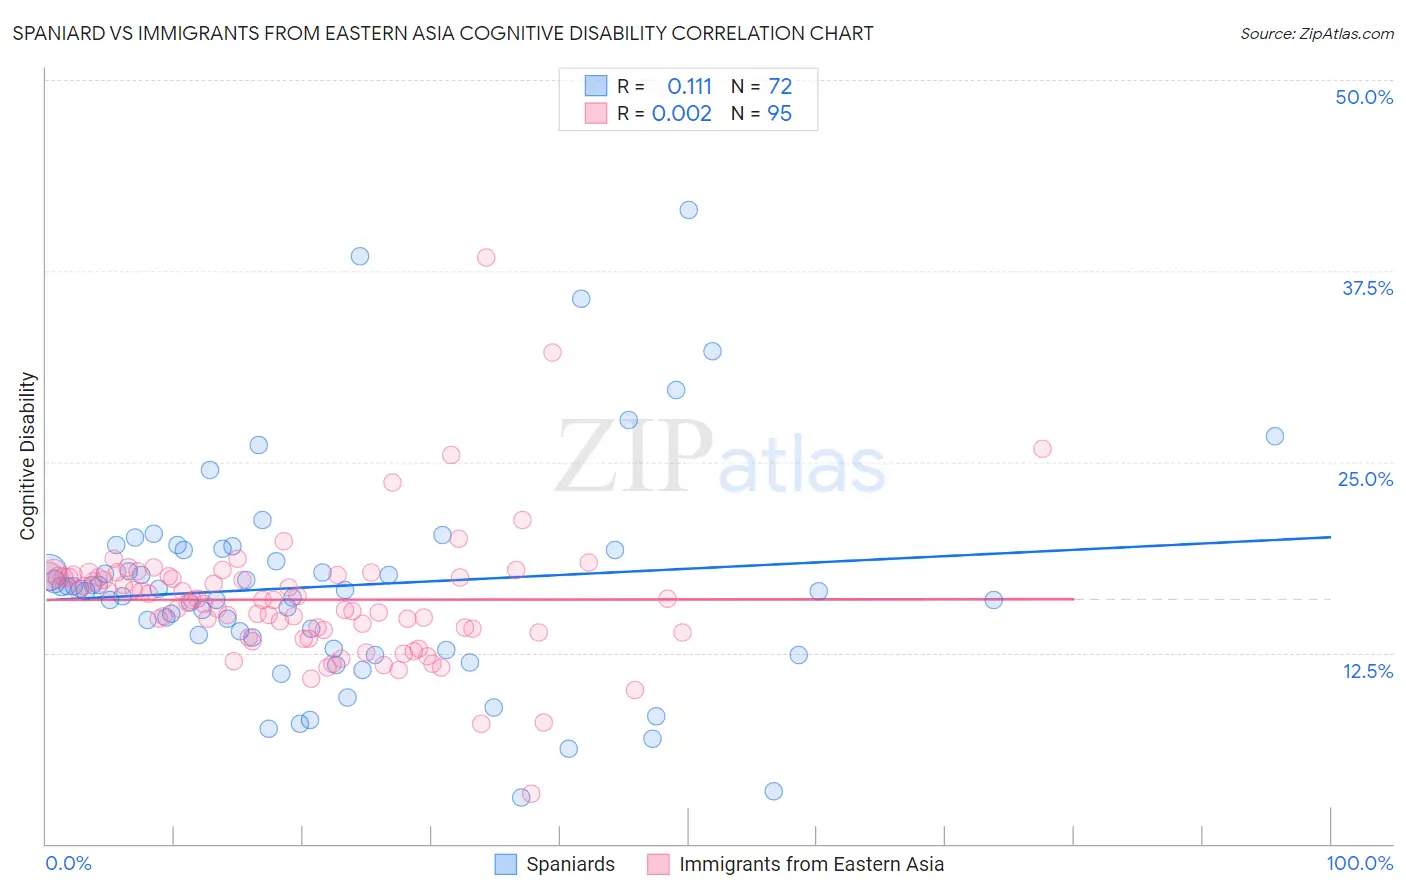
Spaniard vs Immigrants from Eastern Asia Cognitive Disability Correlation Chart
The statistical analysis conducted on geographies consisting of 443,445,256 people shows a poor positive correlation between the proportion of Spaniards and percentage of population with cognitive disability in the United States with a correlation coefficient (R) of 0.111 and weighted average of 17.3%. Similarly, the statistical analysis conducted on geographies consisting of 499,882,322 people shows no correlation between the proportion of Immigrants from Eastern Asia and percentage of population with cognitive disability in the United States with a correlation coefficient (R) of 0.002 and weighted average of 16.8%, a difference of 3.1%.
Cognitive Disability Correlation Summary
| Measurement | Spaniard | Immigrants from Eastern Asia |
| Minimum | 3.0% | 3.3% |
| Maximum | 41.5% | 38.4% |
| Range | 38.5% | 35.1% |
| Mean | 16.9% | 16.0% |
| Median | 16.6% | 16.0% |
| Interquartile 25% (IQ1) | 13.1% | 13.9% |
| Interquartile 75% (IQ3) | 19.2% | 17.5% |
| Interquartile Range (IQR) | 6.1% | 3.6% |
| Standard Deviation (Sample) | 7.1% | 4.3% |
| Standard Deviation (Population) | 7.0% | 4.3% |
Similar Demographics by Cognitive Disability
Demographics Similar to Spaniards by Cognitive Disability
In terms of cognitive disability, the demographic groups most similar to Spaniards are Crow (17.3%, a difference of 0.040%), Afghan (17.3%, a difference of 0.060%), Immigrants from Guyana (17.3%, a difference of 0.070%), Arab (17.3%, a difference of 0.070%), and Pakistani (17.3%, a difference of 0.10%).
| Demographics | Rating | Rank | Cognitive Disability |
| Shoshone | 49.2 /100 | #176 | Average 17.3% |
| Ute | 49.1 /100 | #177 | Average 17.3% |
| Spanish | 48.9 /100 | #178 | Average 17.3% |
| Sioux | 48.6 /100 | #179 | Average 17.3% |
| Pakistanis | 43.9 /100 | #180 | Average 17.3% |
| Immigrants | Guyana | 42.9 /100 | #181 | Average 17.3% |
| Arabs | 42.8 /100 | #182 | Average 17.3% |
| Spaniards | 40.3 /100 | #183 | Average 17.3% |
| Crow | 39.1 /100 | #184 | Fair 17.3% |
| Afghans | 38.2 /100 | #185 | Fair 17.3% |
| Cambodians | 35.9 /100 | #186 | Fair 17.3% |
| Immigrants | Fiji | 33.7 /100 | #187 | Fair 17.4% |
| Immigrants | France | 29.8 /100 | #188 | Fair 17.4% |
| Immigrants | Western Asia | 29.5 /100 | #189 | Fair 17.4% |
| Immigrants | Spain | 27.7 /100 | #190 | Fair 17.4% |
Demographics Similar to Immigrants from Eastern Asia by Cognitive Disability
In terms of cognitive disability, the demographic groups most similar to Immigrants from Eastern Asia are Paraguayan (16.8%, a difference of 0.010%), Palestinian (16.8%, a difference of 0.010%), Northern European (16.8%, a difference of 0.040%), Irish (16.8%, a difference of 0.060%), and Immigrants from Nicaragua (16.8%, a difference of 0.060%).
| Demographics | Rating | Rank | Cognitive Disability |
| Immigrants | Lebanon | 98.4 /100 | #98 | Exceptional 16.8% |
| Jordanians | 98.2 /100 | #99 | Exceptional 16.8% |
| Immigrants | Russia | 98.2 /100 | #100 | Exceptional 16.8% |
| Immigrants | Asia | 98.1 /100 | #101 | Exceptional 16.8% |
| Irish | 98.1 /100 | #102 | Exceptional 16.8% |
| Paraguayans | 98.0 /100 | #103 | Exceptional 16.8% |
| Palestinians | 98.0 /100 | #104 | Exceptional 16.8% |
| Immigrants | Eastern Asia | 97.9 /100 | #105 | Exceptional 16.8% |
| Northern Europeans | 97.8 /100 | #106 | Exceptional 16.8% |
| Immigrants | Nicaragua | 97.8 /100 | #107 | Exceptional 16.8% |
| Canadians | 97.5 /100 | #108 | Exceptional 16.8% |
| Albanians | 97.3 /100 | #109 | Exceptional 16.8% |
| Arapaho | 97.3 /100 | #110 | Exceptional 16.8% |
| Uruguayans | 97.2 /100 | #111 | Exceptional 16.8% |
| Indians (Asian) | 97.2 /100 | #112 | Exceptional 16.8% |