Brazilian vs Immigrants from Scotland Cognitive Disability
COMPARE
Brazilian
Immigrants from Scotland
Cognitive Disability
Cognitive Disability Comparison
Brazilians
Immigrants from Scotland
17.1%
COGNITIVE DISABILITY
78.9/ 100
METRIC RATING
155th/ 347
METRIC RANK
16.2%
COGNITIVE DISABILITY
100.0/ 100
METRIC RATING
10th/ 347
METRIC RANK
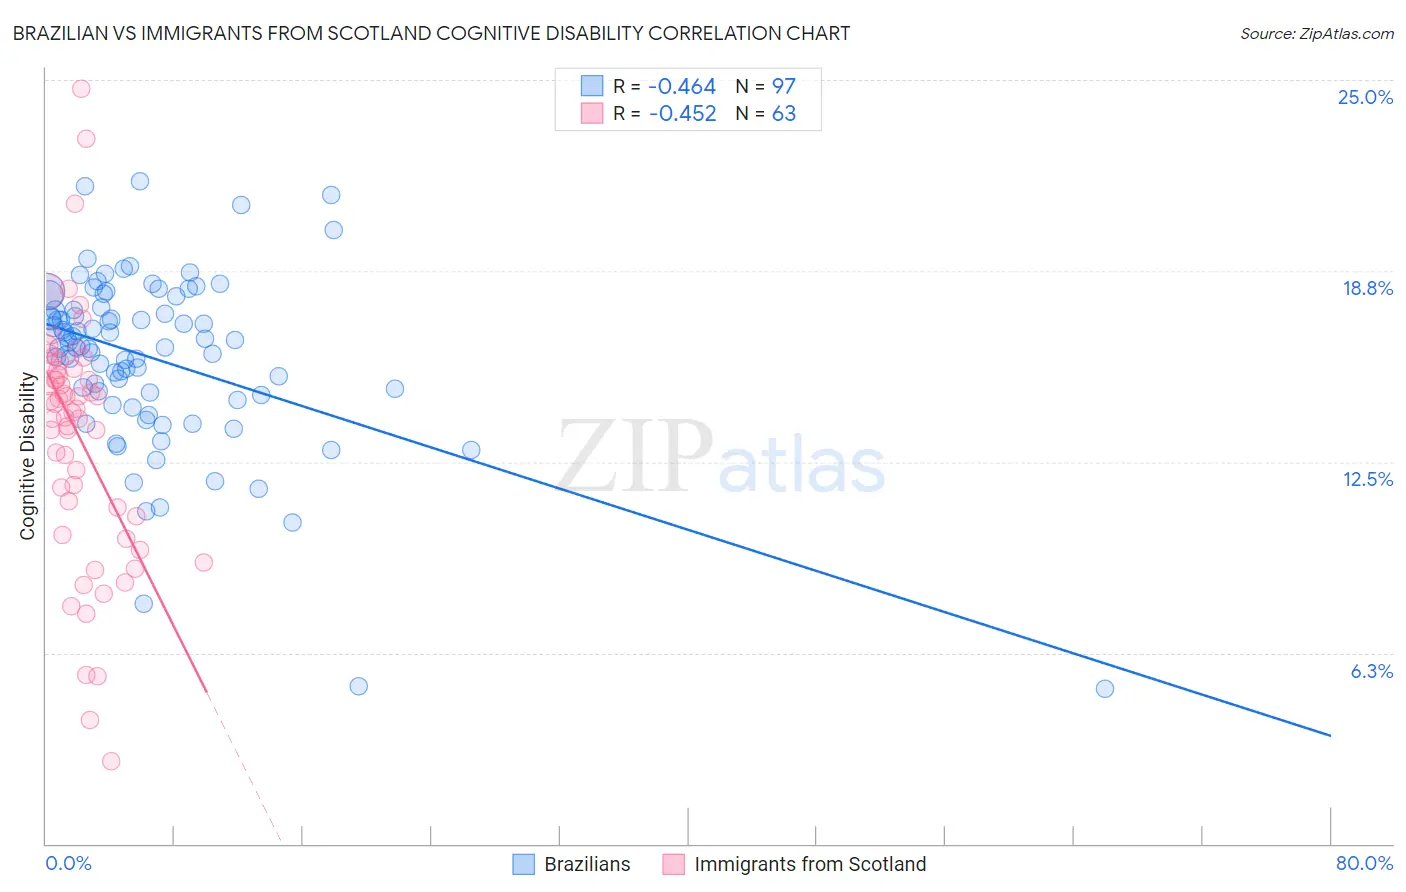
Brazilian vs Immigrants from Scotland Cognitive Disability Correlation Chart
The statistical analysis conducted on geographies consisting of 323,952,153 people shows a moderate negative correlation between the proportion of Brazilians and percentage of population with cognitive disability in the United States with a correlation coefficient (R) of -0.464 and weighted average of 17.1%. Similarly, the statistical analysis conducted on geographies consisting of 196,398,604 people shows a moderate negative correlation between the proportion of Immigrants from Scotland and percentage of population with cognitive disability in the United States with a correlation coefficient (R) of -0.452 and weighted average of 16.2%, a difference of 5.7%.
Cognitive Disability Correlation Summary
| Measurement | Brazilian | Immigrants from Scotland |
| Minimum | 5.1% | 2.7% |
| Maximum | 21.7% | 24.7% |
| Range | 16.6% | 22.0% |
| Mean | 15.9% | 13.3% |
| Median | 16.3% | 14.3% |
| Interquartile 25% (IQ1) | 14.6% | 10.7% |
| Interquartile 75% (IQ3) | 17.5% | 15.5% |
| Interquartile Range (IQR) | 2.9% | 4.8% |
| Standard Deviation (Sample) | 2.9% | 4.1% |
| Standard Deviation (Population) | 2.9% | 4.1% |
Similar Demographics by Cognitive Disability
Demographics Similar to Brazilians by Cognitive Disability
In terms of cognitive disability, the demographic groups most similar to Brazilians are Sri Lankan (17.1%, a difference of 0.0%), Immigrants from Malaysia (17.1%, a difference of 0.020%), Immigrants from Kazakhstan (17.1%, a difference of 0.070%), Immigrants from Australia (17.1%, a difference of 0.12%), and Immigrants from Indonesia (17.1%, a difference of 0.17%).
| Demographics | Rating | Rank | Cognitive Disability |
| French Canadians | 85.7 /100 | #148 | Excellent 17.1% |
| Cypriots | 85.7 /100 | #149 | Excellent 17.1% |
| Basques | 85.5 /100 | #150 | Excellent 17.1% |
| Syrians | 83.0 /100 | #151 | Excellent 17.1% |
| Immigrants | Indonesia | 82.7 /100 | #152 | Excellent 17.1% |
| Immigrants | Kazakhstan | 80.5 /100 | #153 | Excellent 17.1% |
| Immigrants | Malaysia | 79.3 /100 | #154 | Good 17.1% |
| Brazilians | 78.9 /100 | #155 | Good 17.1% |
| Sri Lankans | 78.9 /100 | #156 | Good 17.1% |
| Immigrants | Australia | 76.0 /100 | #157 | Good 17.1% |
| Celtics | 74.1 /100 | #158 | Good 17.1% |
| Immigrants | Latvia | 73.2 /100 | #159 | Good 17.2% |
| Australians | 72.4 /100 | #160 | Good 17.2% |
| Americans | 72.2 /100 | #161 | Good 17.2% |
| Yugoslavians | 71.6 /100 | #162 | Good 17.2% |
Demographics Similar to Immigrants from Scotland by Cognitive Disability
In terms of cognitive disability, the demographic groups most similar to Immigrants from Scotland are Assyrian/Chaldean/Syriac (16.2%, a difference of 0.040%), Immigrants from Czechoslovakia (16.2%, a difference of 0.080%), Maltese (16.2%, a difference of 0.25%), Lithuanian (16.3%, a difference of 0.34%), and Immigrants from Poland (16.1%, a difference of 0.36%).
| Demographics | Rating | Rank | Cognitive Disability |
| Chinese | 100.0 /100 | #3 | Exceptional 15.9% |
| Immigrants | Lithuania | 100.0 /100 | #4 | Exceptional 16.0% |
| Immigrants | Hong Kong | 100.0 /100 | #5 | Exceptional 16.0% |
| Thais | 100.0 /100 | #6 | Exceptional 16.1% |
| Immigrants | Ireland | 100.0 /100 | #7 | Exceptional 16.1% |
| Immigrants | Poland | 100.0 /100 | #8 | Exceptional 16.1% |
| Assyrians/Chaldeans/Syriacs | 100.0 /100 | #9 | Exceptional 16.2% |
| Immigrants | Scotland | 100.0 /100 | #10 | Exceptional 16.2% |
| Immigrants | Czechoslovakia | 100.0 /100 | #11 | Exceptional 16.2% |
| Maltese | 100.0 /100 | #12 | Exceptional 16.2% |
| Lithuanians | 100.0 /100 | #13 | Exceptional 16.3% |
| Immigrants | Austria | 100.0 /100 | #14 | Exceptional 16.3% |
| Immigrants | Greece | 100.0 /100 | #15 | Exceptional 16.3% |
| Eastern Europeans | 100.0 /100 | #16 | Exceptional 16.3% |
| Immigrants | North Macedonia | 100.0 /100 | #17 | Exceptional 16.3% |