Fijian vs Immigrants from Iran Disability Age 5 to 17
COMPARE
Fijian
Immigrants from Iran
Disability Age 5 to 17
Disability Age 5 to 17 Comparison
Fijians
Immigrants from Iran
5.7%
DISABILITY AGE 5 TO 17
31.7/ 100
METRIC RATING
186th/ 347
METRIC RANK
4.4%
DISABILITY AGE 5 TO 17
100.0/ 100
METRIC RATING
5th/ 347
METRIC RANK
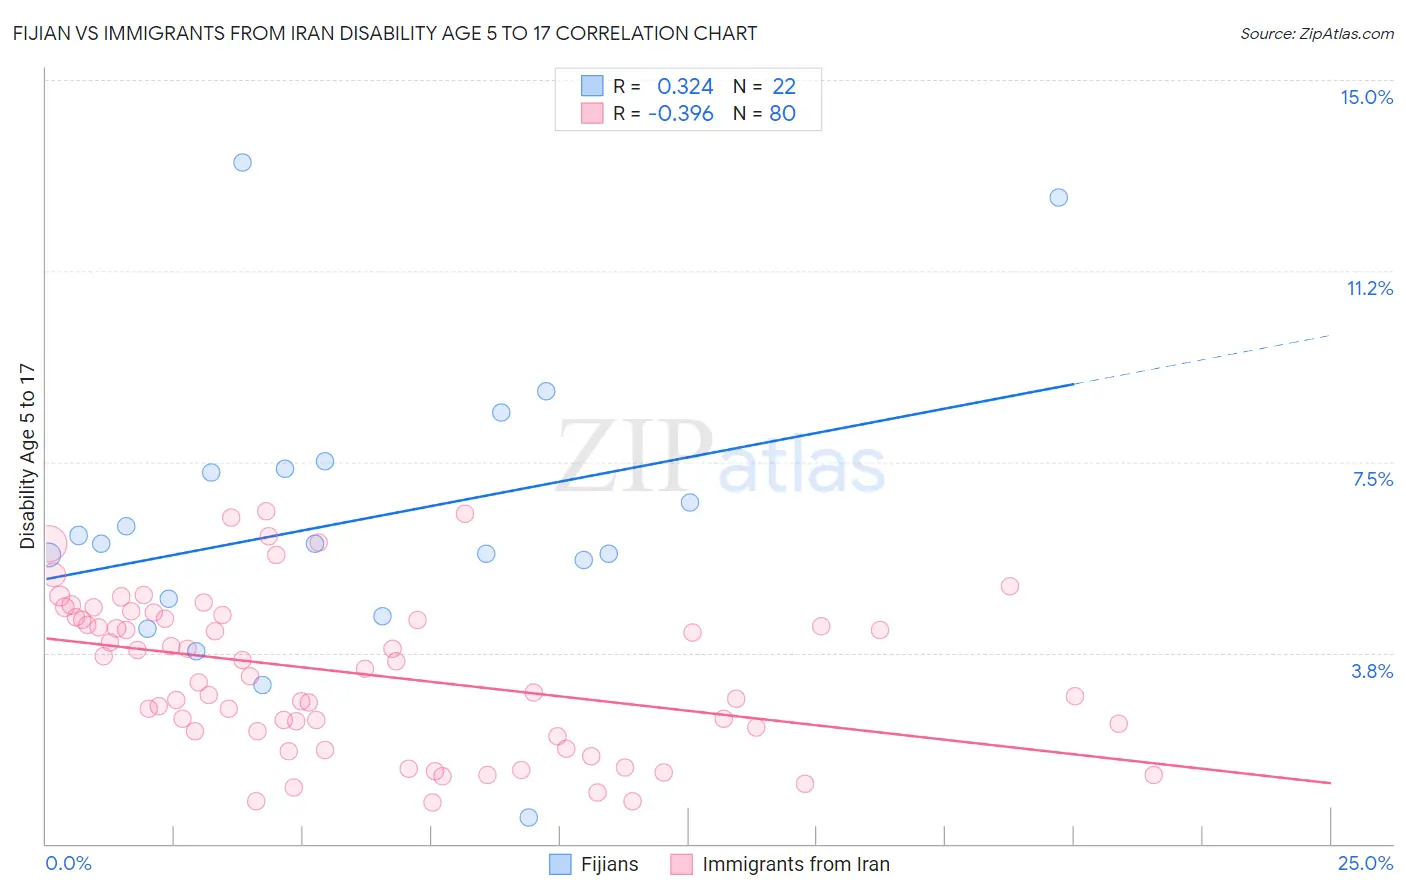
Fijian vs Immigrants from Iran Disability Age 5 to 17 Correlation Chart
The statistical analysis conducted on geographies consisting of 55,882,299 people shows a mild positive correlation between the proportion of Fijians and percentage of population with a disability between the ages 5 and 17 in the United States with a correlation coefficient (R) of 0.324 and weighted average of 5.7%. Similarly, the statistical analysis conducted on geographies consisting of 278,151,157 people shows a mild negative correlation between the proportion of Immigrants from Iran and percentage of population with a disability between the ages 5 and 17 in the United States with a correlation coefficient (R) of -0.396 and weighted average of 4.4%, a difference of 29.6%.
Disability Age 5 to 17 Correlation Summary
| Measurement | Fijian | Immigrants from Iran |
| Minimum | 0.51% | 0.81% |
| Maximum | 13.4% | 6.5% |
| Range | 12.9% | 5.7% |
| Mean | 6.4% | 3.3% |
| Median | 5.9% | 3.4% |
| Interquartile 25% (IQ1) | 4.8% | 2.2% |
| Interquartile 75% (IQ3) | 7.4% | 4.4% |
| Interquartile Range (IQR) | 2.6% | 2.2% |
| Standard Deviation (Sample) | 2.8% | 1.5% |
| Standard Deviation (Population) | 2.8% | 1.5% |
Similar Demographics by Disability Age 5 to 17
Demographics Similar to Fijians by Disability Age 5 to 17
In terms of disability age 5 to 17, the demographic groups most similar to Fijians are Immigrants from Thailand (5.7%, a difference of 0.090%), Immigrants from Mexico (5.6%, a difference of 0.11%), Syrian (5.6%, a difference of 0.12%), Immigrants from Latin America (5.6%, a difference of 0.14%), and Mexican American Indian (5.6%, a difference of 0.20%).
| Demographics | Rating | Rank | Disability Age 5 to 17 |
| Immigrants | Barbados | 40.5 /100 | #179 | Average 5.6% |
| Immigrants | Uruguay | 37.7 /100 | #180 | Fair 5.6% |
| Immigrants | England | 36.4 /100 | #181 | Fair 5.6% |
| Mexican American Indians | 35.2 /100 | #182 | Fair 5.6% |
| Immigrants | Latin America | 34.3 /100 | #183 | Fair 5.6% |
| Syrians | 33.8 /100 | #184 | Fair 5.6% |
| Immigrants | Mexico | 33.7 /100 | #185 | Fair 5.6% |
| Fijians | 31.7 /100 | #186 | Fair 5.7% |
| Immigrants | Thailand | 30.2 /100 | #187 | Fair 5.7% |
| Marshallese | 28.1 /100 | #188 | Fair 5.7% |
| Pueblo | 27.5 /100 | #189 | Fair 5.7% |
| Immigrants | Eastern Africa | 27.3 /100 | #190 | Fair 5.7% |
| Danes | 26.5 /100 | #191 | Fair 5.7% |
| Immigrants | Bosnia and Herzegovina | 26.3 /100 | #192 | Fair 5.7% |
| Immigrants | Canada | 26.1 /100 | #193 | Fair 5.7% |
Demographics Similar to Immigrants from Iran by Disability Age 5 to 17
In terms of disability age 5 to 17, the demographic groups most similar to Immigrants from Iran are Filipino (4.3%, a difference of 0.55%), Immigrants from Hong Kong (4.3%, a difference of 1.5%), Immigrants from Israel (4.5%, a difference of 3.4%), Immigrants from China (4.5%, a difference of 3.7%), and Immigrants from Taiwan (4.2%, a difference of 4.1%).
| Demographics | Rating | Rank | Disability Age 5 to 17 |
| Immigrants | Armenia | 100.0 /100 | #1 | Exceptional 4.1% |
| Immigrants | Taiwan | 100.0 /100 | #2 | Exceptional 4.2% |
| Immigrants | Hong Kong | 100.0 /100 | #3 | Exceptional 4.3% |
| Filipinos | 100.0 /100 | #4 | Exceptional 4.3% |
| Immigrants | Iran | 100.0 /100 | #5 | Exceptional 4.4% |
| Immigrants | Israel | 100.0 /100 | #6 | Exceptional 4.5% |
| Immigrants | China | 100.0 /100 | #7 | Exceptional 4.5% |
| Indians (Asian) | 100.0 /100 | #8 | Exceptional 4.6% |
| Immigrants | Eastern Asia | 100.0 /100 | #9 | Exceptional 4.6% |
| Immigrants | India | 100.0 /100 | #10 | Exceptional 4.6% |
| Armenians | 100.0 /100 | #11 | Exceptional 4.6% |
| Iranians | 100.0 /100 | #12 | Exceptional 4.6% |
| Thais | 100.0 /100 | #13 | Exceptional 4.7% |
| Immigrants | Korea | 100.0 /100 | #14 | Exceptional 4.7% |
| Chinese | 100.0 /100 | #15 | Exceptional 4.7% |