Spaniard vs White/Caucasian Disability Age 65 to 74
COMPARE
Spaniard
White/Caucasian
Disability Age 65 to 74
Disability Age 65 to 74 Comparison
Spaniards
Whites/Caucasians
24.6%
DISABILITY AGE 65 TO 74
2.4/ 100
METRIC RATING
240th/ 347
METRIC RANK
24.2%
DISABILITY AGE 65 TO 74
6.6/ 100
METRIC RATING
228th/ 347
METRIC RANK
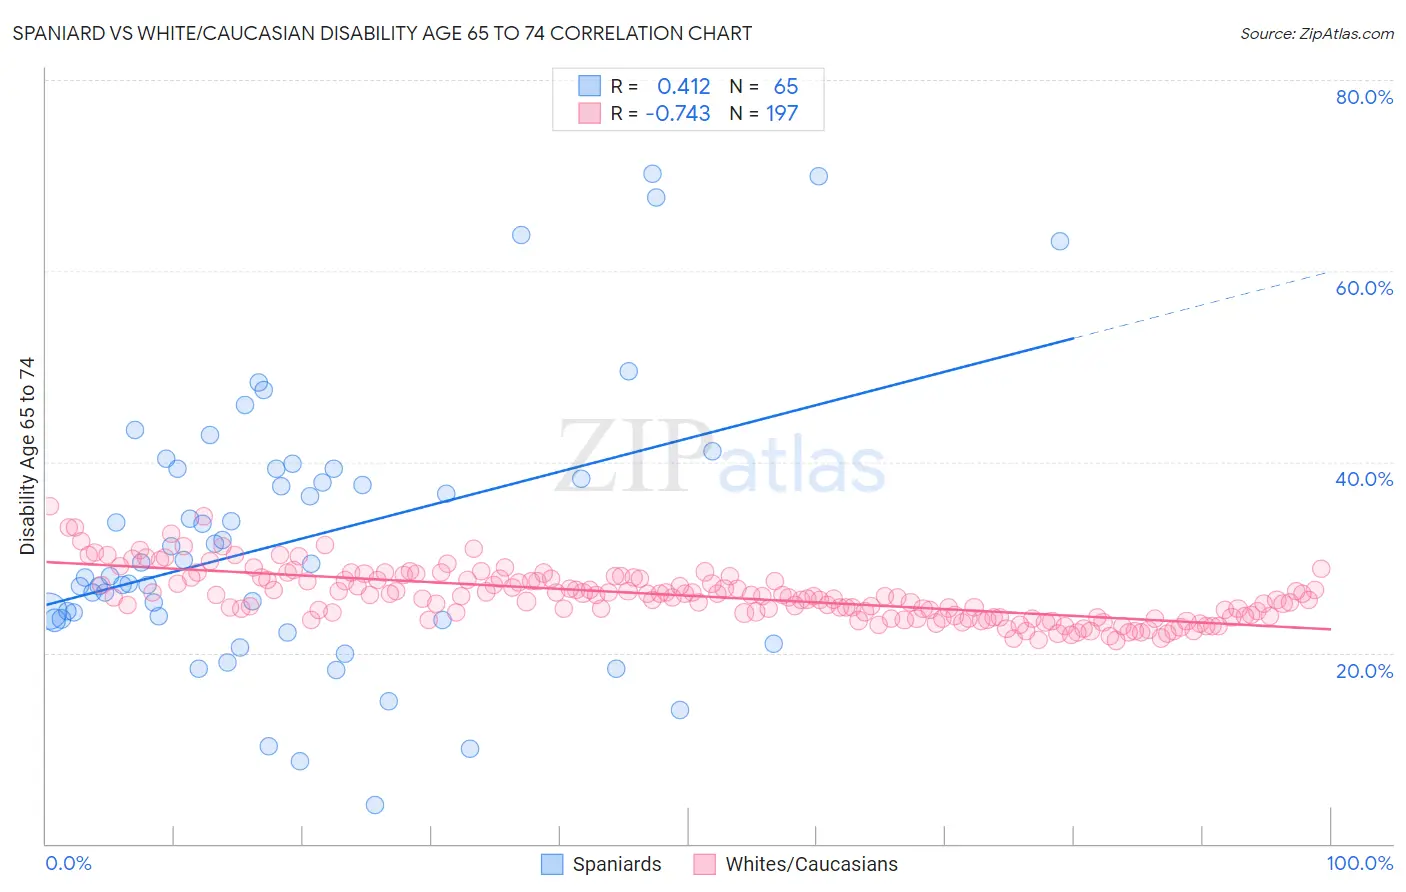
Spaniard vs White/Caucasian Disability Age 65 to 74 Correlation Chart
The statistical analysis conducted on geographies consisting of 442,368,697 people shows a moderate positive correlation between the proportion of Spaniards and percentage of population with a disability between the ages 65 and 75 in the United States with a correlation coefficient (R) of 0.412 and weighted average of 24.6%. Similarly, the statistical analysis conducted on geographies consisting of 580,018,355 people shows a strong negative correlation between the proportion of Whites/Caucasians and percentage of population with a disability between the ages 65 and 75 in the United States with a correlation coefficient (R) of -0.743 and weighted average of 24.2%, a difference of 1.5%.
Disability Age 65 to 74 Correlation Summary
| Measurement | Spaniard | White/Caucasian |
| Minimum | 4.0% | 21.3% |
| Maximum | 70.1% | 35.4% |
| Range | 66.1% | 14.1% |
| Mean | 31.9% | 26.0% |
| Median | 29.3% | 25.8% |
| Interquartile 25% (IQ1) | 23.5% | 23.7% |
| Interquartile 75% (IQ3) | 39.3% | 27.7% |
| Interquartile Range (IQR) | 15.8% | 4.0% |
| Standard Deviation (Sample) | 14.2% | 2.7% |
| Standard Deviation (Population) | 14.1% | 2.7% |
Demographics Similar to Spaniards and Whites/Caucasians by Disability Age 65 to 74
In terms of disability age 65 to 74, the demographic groups most similar to Spaniards are Immigrants from Western Africa (24.6%, a difference of 0.080%), Immigrants from Caribbean (24.6%, a difference of 0.090%), Immigrants from Senegal (24.6%, a difference of 0.16%), Spanish (24.6%, a difference of 0.18%), and Armenian (24.7%, a difference of 0.30%). Similarly, the demographic groups most similar to Whites/Caucasians are Celtic (24.2%, a difference of 0.050%), Barbadian (24.3%, a difference of 0.16%), Nigerian (24.2%, a difference of 0.25%), Iraqi (24.2%, a difference of 0.31%), and Bermudan (24.2%, a difference of 0.32%).
| Demographics | Rating | Rank | Disability Age 65 to 74 |
| Immigrants | Panama | 8.6 /100 | #224 | Tragic 24.1% |
| Bermudans | 8.2 /100 | #225 | Tragic 24.2% |
| Iraqis | 8.1 /100 | #226 | Tragic 24.2% |
| Nigerians | 7.8 /100 | #227 | Tragic 24.2% |
| Whites/Caucasians | 6.6 /100 | #228 | Tragic 24.2% |
| Celtics | 6.4 /100 | #229 | Tragic 24.2% |
| Barbadians | 6.0 /100 | #230 | Tragic 24.3% |
| Immigrants | Thailand | 5.2 /100 | #231 | Tragic 24.3% |
| Immigrants | Zaire | 5.0 /100 | #232 | Tragic 24.3% |
| Bahamians | 4.5 /100 | #233 | Tragic 24.4% |
| Panamanians | 4.2 /100 | #234 | Tragic 24.4% |
| Scotch-Irish | 3.8 /100 | #235 | Tragic 24.4% |
| German Russians | 3.7 /100 | #236 | Tragic 24.4% |
| West Indians | 3.4 /100 | #237 | Tragic 24.5% |
| Immigrants | Ghana | 3.0 /100 | #238 | Tragic 24.5% |
| Immigrants | Caribbean | 2.6 /100 | #239 | Tragic 24.6% |
| Spaniards | 2.4 /100 | #240 | Tragic 24.6% |
| Immigrants | Western Africa | 2.3 /100 | #241 | Tragic 24.6% |
| Immigrants | Senegal | 2.2 /100 | #242 | Tragic 24.6% |
| Spanish | 2.2 /100 | #243 | Tragic 24.6% |
| Armenians | 2.0 /100 | #244 | Tragic 24.7% |