Spaniard vs Immigrants from Austria Disability Age 65 to 74
COMPARE
Spaniard
Immigrants from Austria
Disability Age 65 to 74
Disability Age 65 to 74 Comparison
Spaniards
Immigrants from Austria
24.6%
DISABILITY AGE 65 TO 74
2.4/ 100
METRIC RATING
240th/ 347
METRIC RANK
21.2%
DISABILITY AGE 65 TO 74
99.8/ 100
METRIC RATING
41st/ 347
METRIC RANK
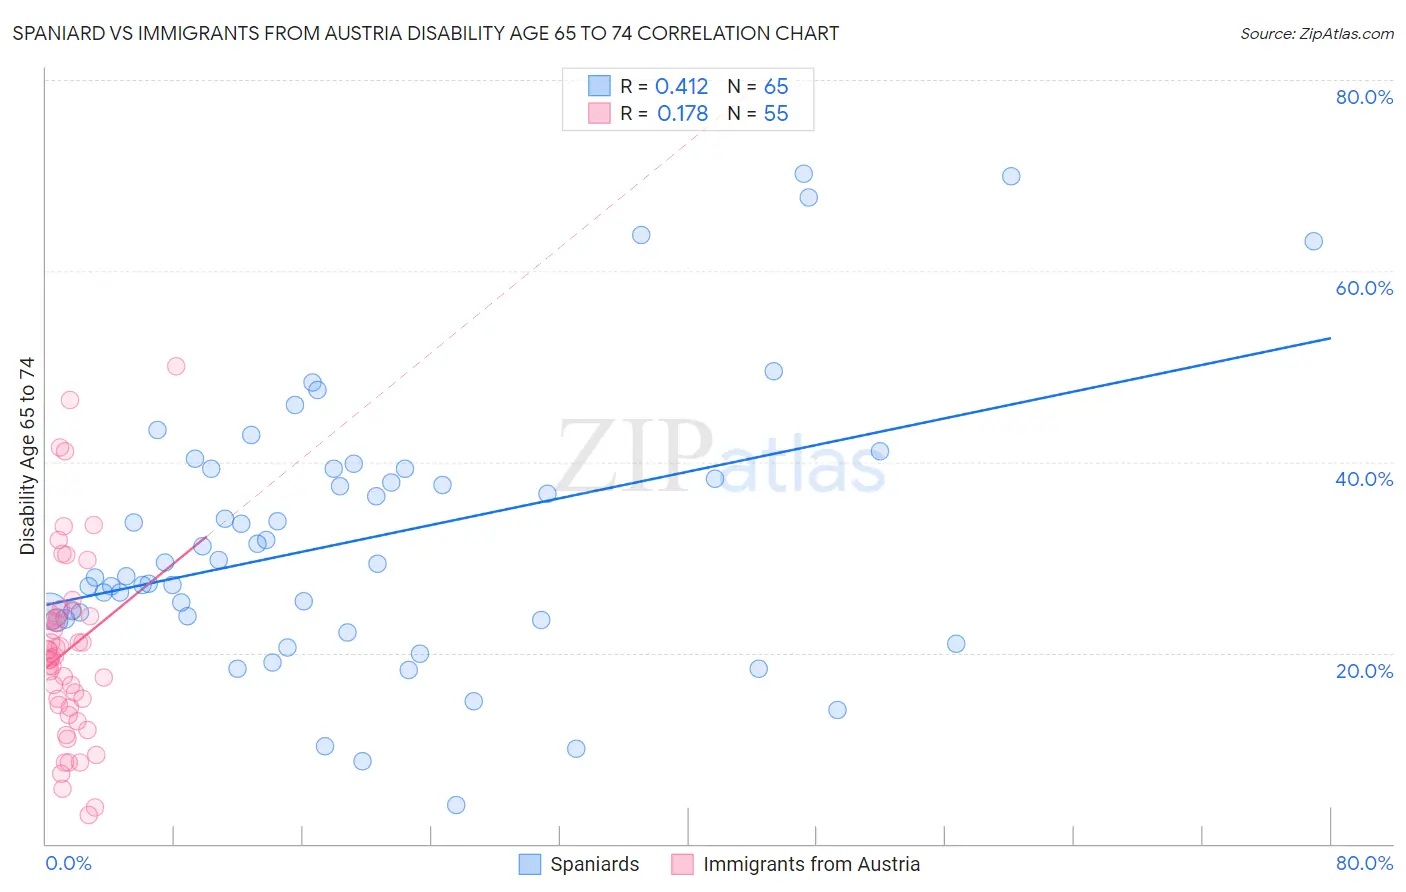
Spaniard vs Immigrants from Austria Disability Age 65 to 74 Correlation Chart
The statistical analysis conducted on geographies consisting of 442,368,697 people shows a moderate positive correlation between the proportion of Spaniards and percentage of population with a disability between the ages 65 and 75 in the United States with a correlation coefficient (R) of 0.412 and weighted average of 24.6%. Similarly, the statistical analysis conducted on geographies consisting of 167,894,015 people shows a poor positive correlation between the proportion of Immigrants from Austria and percentage of population with a disability between the ages 65 and 75 in the United States with a correlation coefficient (R) of 0.178 and weighted average of 21.2%, a difference of 15.8%.
Disability Age 65 to 74 Correlation Summary
| Measurement | Spaniard | Immigrants from Austria |
| Minimum | 4.0% | 3.0% |
| Maximum | 70.1% | 50.0% |
| Range | 66.1% | 47.0% |
| Mean | 31.9% | 20.4% |
| Median | 29.3% | 19.5% |
| Interquartile 25% (IQ1) | 23.5% | 14.3% |
| Interquartile 75% (IQ3) | 39.3% | 23.9% |
| Interquartile Range (IQR) | 15.8% | 9.6% |
| Standard Deviation (Sample) | 14.2% | 10.0% |
| Standard Deviation (Population) | 14.1% | 9.9% |
Similar Demographics by Disability Age 65 to 74
Demographics Similar to Spaniards by Disability Age 65 to 74
In terms of disability age 65 to 74, the demographic groups most similar to Spaniards are Immigrants from Western Africa (24.6%, a difference of 0.080%), Immigrants from Caribbean (24.6%, a difference of 0.090%), Immigrants from Senegal (24.6%, a difference of 0.16%), Spanish (24.6%, a difference of 0.18%), and Armenian (24.7%, a difference of 0.30%).
| Demographics | Rating | Rank | Disability Age 65 to 74 |
| Bahamians | 4.5 /100 | #233 | Tragic 24.4% |
| Panamanians | 4.2 /100 | #234 | Tragic 24.4% |
| Scotch-Irish | 3.8 /100 | #235 | Tragic 24.4% |
| German Russians | 3.7 /100 | #236 | Tragic 24.4% |
| West Indians | 3.4 /100 | #237 | Tragic 24.5% |
| Immigrants | Ghana | 3.0 /100 | #238 | Tragic 24.5% |
| Immigrants | Caribbean | 2.6 /100 | #239 | Tragic 24.6% |
| Spaniards | 2.4 /100 | #240 | Tragic 24.6% |
| Immigrants | Western Africa | 2.3 /100 | #241 | Tragic 24.6% |
| Immigrants | Senegal | 2.2 /100 | #242 | Tragic 24.6% |
| Spanish | 2.2 /100 | #243 | Tragic 24.6% |
| Armenians | 2.0 /100 | #244 | Tragic 24.7% |
| British West Indians | 2.0 /100 | #245 | Tragic 24.7% |
| Immigrants | Iraq | 1.9 /100 | #246 | Tragic 24.7% |
| Indonesians | 1.1 /100 | #247 | Tragic 24.9% |
Demographics Similar to Immigrants from Austria by Disability Age 65 to 74
In terms of disability age 65 to 74, the demographic groups most similar to Immigrants from Austria are Latvian (21.2%, a difference of 0.060%), Argentinean (21.2%, a difference of 0.23%), Israeli (21.2%, a difference of 0.41%), Russian (21.2%, a difference of 0.41%), and Macedonian (21.3%, a difference of 0.43%).
| Demographics | Rating | Rank | Disability Age 65 to 74 |
| Immigrants | Sri Lanka | 99.9 /100 | #34 | Exceptional 21.1% |
| Bulgarians | 99.9 /100 | #35 | Exceptional 21.1% |
| Immigrants | Switzerland | 99.8 /100 | #36 | Exceptional 21.1% |
| Israelis | 99.8 /100 | #37 | Exceptional 21.2% |
| Russians | 99.8 /100 | #38 | Exceptional 21.2% |
| Argentineans | 99.8 /100 | #39 | Exceptional 21.2% |
| Latvians | 99.8 /100 | #40 | Exceptional 21.2% |
| Immigrants | Austria | 99.8 /100 | #41 | Exceptional 21.2% |
| Macedonians | 99.7 /100 | #42 | Exceptional 21.3% |
| Immigrants | Croatia | 99.7 /100 | #43 | Exceptional 21.3% |
| Estonians | 99.7 /100 | #44 | Exceptional 21.4% |
| Asians | 99.7 /100 | #45 | Exceptional 21.4% |
| Immigrants | Turkey | 99.7 /100 | #46 | Exceptional 21.4% |
| Immigrants | Bulgaria | 99.7 /100 | #47 | Exceptional 21.4% |
| Lithuanians | 99.7 /100 | #48 | Exceptional 21.4% |