South American Indian vs French Disability Age 5 to 17

COMPARE

South American Indian
Race
Ancestry
AfghanAfricanAlaska NativeAlaskan AthabascanAlbanianAleutAlsatianAmericanApacheArabArapahoArgentineanArmenianAssyrian/Chaldean/SyriacAustralianAustrianBahamianBangladeshiBarbadianBasqueBelgianBelizeanBermudanBhutaneseBlackfeetBolivianBrazilianBritishBritish West IndianBulgarianBurmeseCajunCambodianCanadianCape VerdeanCarpatho RusynCelticCentral AmericanCentral American IndianCherokeeCheyenneChickasawChileanChineseChippewaChoctawColombianColvilleComancheCosta RicanCreeCreekCroatianCrowCubanCypriotCzechCzechoslovakianDanishDelawareDominicanDutchDutch West IndianEastern EuropeanEcuadorianEgyptianEnglishEstonianEthiopianEuropeanFijianFilipinoFinnishFrench American IndianFrench CanadianGermanGerman RussianGhanaianGreekGuamanian/ChamorroGuatemalanGuyaneseHaitianHmongHonduranHopiHoumaHungarianIcelanderIndian (Asian)IndonesianInupiatIranianIraqiIrishIroquoisIsraeliItalianJamaicanJapaneseJordanianKenyanKiowaKoreanLaotianLatvianLebaneseLiberianLithuanianLumbeeLuxembourgerMacedonianMalaysianMalteseMarshalleseMenomineeMexicanMexican American IndianMongolianMoroccanNative HawaiianNavajoNepaleseNew ZealanderNicaraguanNigerianNorthern EuropeanNorwegianOkinawanOsageOttawaPaiutePakistaniPalestinianPanamanianParaguayanPennsylvania GermanPeruvianPimaPolishPortuguesePotawatomiPuebloPuerto RicanPuget Sound SalishRomanianRussianSalvadoranSamoanScandinavianScotch-IrishScottishSeminoleSenegaleseSerbianShoshoneSierra LeoneanSiouxSlavicSlovakSloveneSomaliSouth AfricanSouth AmericanSouth American IndianSoviet UnionSpaniardSpanishSpanish AmericanSpanish American IndianSri LankanSubsaharan AfricanSudaneseSwedishSwissSyrianTaiwaneseThaiTlingit-HaidaTohono O'OdhamTonganTrinidadian and TobagonianTsimshianTurkishU.S. Virgin IslanderUgandanUkrainianUruguayanUteVenezuelanVietnameseWelshWest IndianYakamaYaquiYugoslavianYumanYup'ikZimbabwean
Immigration
NonimmigrantsImmigrantsAfghanistanAfricaAlbaniaArgentinaArmeniaAsiaAustraliaAustriaBahamasBangladeshBarbadosBelarusBelgiumBelizeBoliviaBosnia and HerzegovinaBrazilBulgariaBurma/MyanmarCabo VerdeCambodiaCameroonCanadaCaribbeanCentral AmericaChileChinaColombiaCongoCosta RicaCroatiaCubaCzechoslovakiaDenmarkDominicaDominican RepublicEastern AfricaEastern AsiaEastern EuropeEcuadorEgyptEl SalvadorEnglandEritreaEthiopiaEuropeFijiFranceGermanyGhanaGreeceGrenadaGuatemalaGuyanaHaitiHondurasHong KongHungaryIndiaIndonesiaIranIraqIrelandIsraelItalyJamaicaJapanJordanKazakhstanKenyaKoreaKuwaitLaosLatin AmericaLatviaLebanonLiberiaLithuaniaMalaysiaMexicoMicronesiaMiddle AfricaMoldovaMoroccoNepalNetherlandsNicaraguaNigeriaNorth AmericaNorth MacedoniaNorthern AfricaNorthern EuropeNorwayOceaniaPakistanPanamaPeruPhilippinesPolandPortugalRomaniaRussiaSaudi ArabiaScotlandSenegalSerbiaSierra LeoneSingaporeSomaliaSouth AfricaSouth AmericaSouth Central AsiaSouth Eastern AsiaSouthern EuropeSpainSri LankaSt. Vincent and the GrenadinesSudanSwedenSwitzerlandSyriaTaiwanThailandTrinidad and TobagoTurkeyUgandaUkraineUruguayUzbekistanVenezuelaVietnamWest IndiesWestern AfricaWestern AsiaWestern EuropeYemenZaireZimbabweAzores
French
Race
Ancestry
AfghanAfricanAlaska NativeAlaskan AthabascanAlbanianAleutAlsatianAmericanApacheArabArapahoArgentineanArmenianAssyrian/Chaldean/SyriacAustralianAustrianBahamianBangladeshiBarbadianBasqueBelgianBelizeanBermudanBhutaneseBlackfeetBolivianBrazilianBritishBritish West IndianBulgarianBurmeseCajunCambodianCanadianCape VerdeanCarpatho RusynCelticCentral AmericanCentral American IndianCherokeeCheyenneChickasawChileanChineseChippewaChoctawColombianColvilleComancheCosta RicanCreeCreekCroatianCrowCubanCypriotCzechCzechoslovakianDanishDelawareDominicanDutchDutch West IndianEastern EuropeanEcuadorianEgyptianEnglishEstonianEthiopianEuropeanFijianFilipinoFinnishFrenchFrench American IndianFrench CanadianGermanGerman RussianGhanaianGreekGuamanian/ChamorroGuatemalanGuyaneseHaitianHmongHonduranHopiHoumaHungarianIcelanderIndian (Asian)IndonesianInupiatIranianIraqiIrishIroquoisIsraeliItalianJamaicanJapaneseJordanianKenyanKiowaKoreanLaotianLatvianLebaneseLiberianLithuanianLumbeeLuxembourgerMacedonianMalaysianMalteseMarshalleseMenomineeMexicanMexican American IndianMongolianMoroccanNative HawaiianNavajoNepaleseNew ZealanderNicaraguanNigerianNorthern EuropeanNorwegianOkinawanOsageOttawaPaiutePakistaniPalestinianPanamanianParaguayanPennsylvania GermanPeruvianPimaPolishPortuguesePotawatomiPuebloPuerto RicanPuget Sound SalishRomanianRussianSalvadoranSamoanScandinavianScotch-IrishScottishSeminoleSenegaleseSerbianShoshoneSierra LeoneanSiouxSlavicSlovakSloveneSomaliSouth AfricanSouth AmericanSoviet UnionSpaniardSpanishSpanish AmericanSpanish American IndianSri LankanSubsaharan AfricanSudaneseSwedishSwissSyrianTaiwaneseThaiTlingit-HaidaTohono O'OdhamTonganTrinidadian and TobagonianTsimshianTurkishU.S. Virgin IslanderUgandanUkrainianUruguayanUteVenezuelanVietnameseWelshWest IndianYakamaYaquiYugoslavianYumanYup'ikZimbabwean
Immigration
NonimmigrantsImmigrantsAfghanistanAfricaAlbaniaArgentinaArmeniaAsiaAustraliaAustriaBahamasBangladeshBarbadosBelarusBelgiumBelizeBoliviaBosnia and HerzegovinaBrazilBulgariaBurma/MyanmarCabo VerdeCambodiaCameroonCanadaCaribbeanCentral AmericaChileChinaColombiaCongoCosta RicaCroatiaCubaCzechoslovakiaDenmarkDominicaDominican RepublicEastern AfricaEastern AsiaEastern EuropeEcuadorEgyptEl SalvadorEnglandEritreaEthiopiaEuropeFijiFranceGermanyGhanaGreeceGrenadaGuatemalaGuyanaHaitiHondurasHong KongHungaryIndiaIndonesiaIranIraqIrelandIsraelItalyJamaicaJapanJordanKazakhstanKenyaKoreaKuwaitLaosLatin AmericaLatviaLebanonLiberiaLithuaniaMalaysiaMexicoMicronesiaMiddle AfricaMoldovaMoroccoNepalNetherlandsNicaraguaNigeriaNorth AmericaNorth MacedoniaNorthern AfricaNorthern EuropeNorwayOceaniaPakistanPanamaPeruPhilippinesPolandPortugalRomaniaRussiaSaudi ArabiaScotlandSenegalSerbiaSierra LeoneSingaporeSomaliaSouth AfricaSouth AmericaSouth Central AsiaSouth Eastern AsiaSouthern EuropeSpainSri LankaSt. Vincent and the GrenadinesSudanSwedenSwitzerlandSyriaTaiwanThailandTrinidad and TobagoTurkeyUgandaUkraineUruguayUzbekistanVenezuelaVietnamWest IndiesWestern AfricaWestern AsiaWestern EuropeYemenZaireZimbabweAzores
Disability Age 5 to 17
Income
Poverty
Unemployment
Labor Participation
Family Structure
Vehicle Availability
Education Level
Disability

Disability Age 5 to 17 Comparison

South American Indians

French

Excellent
Tragic
5.5%
DISABILITY AGE 5 TO 17
89.3/ 100
METRIC RATING
141st/ 347
METRIC RANK
6.4%
DISABILITY AGE 5 TO 17
0.0/ 100
METRIC RATING
314th/ 347
METRIC RANK

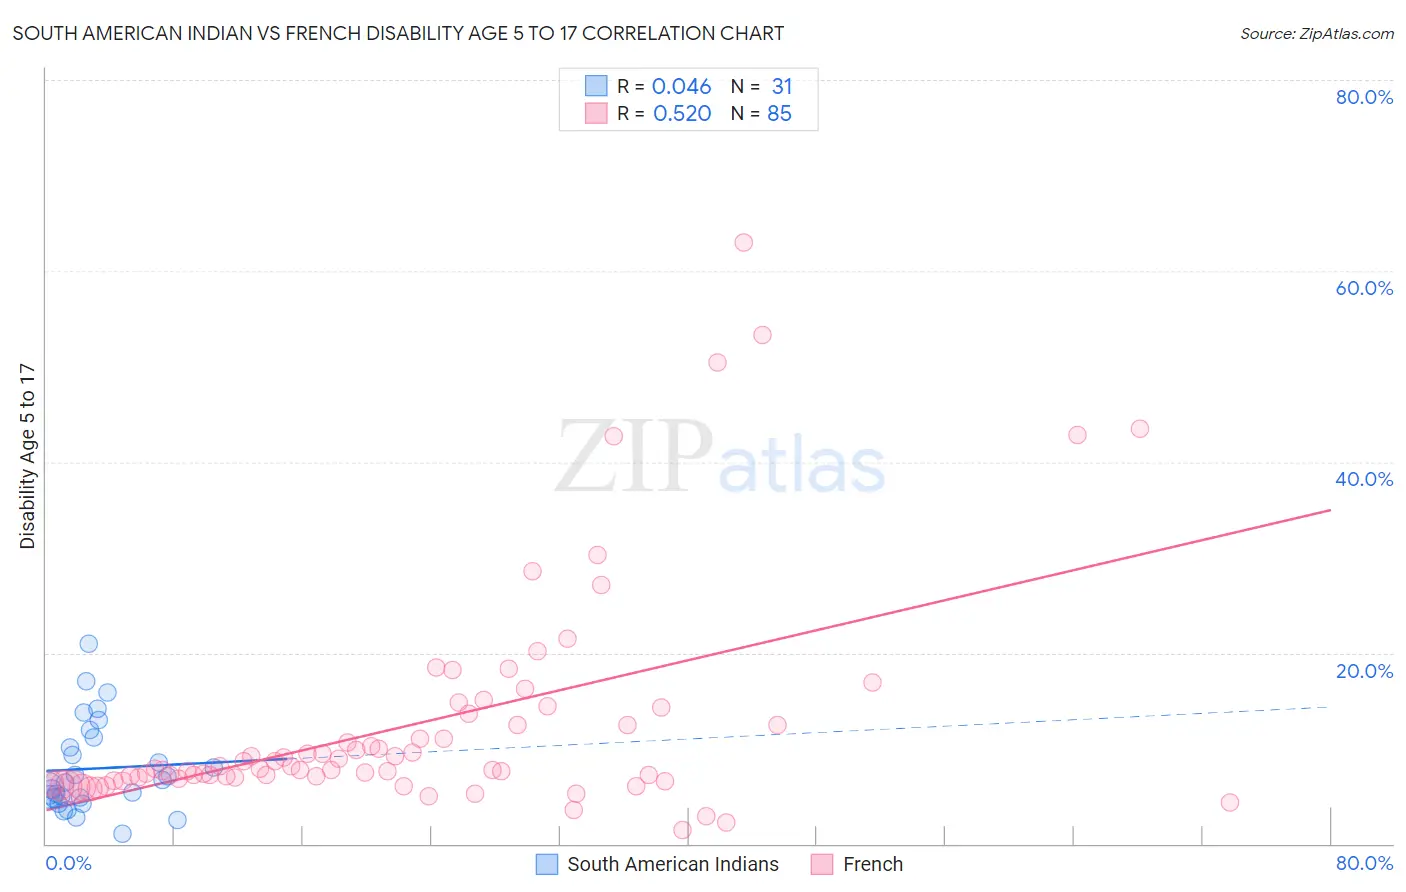
South American Indian vs French Disability Age 5 to 17 Correlation Chart

The statistical analysis conducted on geographies consisting of 164,285,003 people shows no correlation between the proportion of South American Indians and percentage of population with a disability between the ages 5 and 17 in the United States with a correlation coefficient (R) of 0.046 and weighted average of 5.5%. Similarly, the statistical analysis conducted on geographies consisting of 558,470,754 people shows a substantial positive correlation between the proportion of French and percentage of population with a disability between the ages 5 and 17 in the United States with a correlation coefficient (R) of 0.520 and weighted average of 6.4%, a difference of 17.6%.
South American Indian vs French Disability Age 5 to 17

Disability Age 5 to 17 Correlation Summary

MeasurementSouth American IndianFrench
Minimum1.1%1.4%
Maximum20.9%62.9%
Range19.8%61.5%
Mean7.9%12.5%
Median6.4%7.9%
Interquartile 25% (IQ1)4.8%6.7%
Interquartile 75% (IQ3)11.1%13.0%
Interquartile Range (IQR)6.3%6.3%
Standard Deviation (Sample)4.8%11.7%
Standard Deviation (Population)4.7%11.6%

Similar Demographics by Disability Age 5 to 17

Demographics Similar to South American Indians by Disability Age 5 to 17

In terms of disability age 5 to 17, the demographic groups most similar to South American Indians are Colombian (5.5%, a difference of 0.15%), Immigrants from Netherlands (5.4%, a difference of 0.17%), Immigrants from Hungary (5.5%, a difference of 0.17%), Immigrants from Oceania (5.4%, a difference of 0.22%), and Belizean (5.4%, a difference of 0.22%).
DemographicsRating | RankDisability Age 5 to 17
Yuman
92.3
/100
|
#134
Exceptional
5.4%
Immigrants | Belize
91.7
/100
|
#135
Exceptional
5.4%
Immigrants | Denmark
91.4
/100
|
#136
Exceptional
5.4%
Navajo
90.9
/100
|
#137
Exceptional
5.4%
Immigrants | Oceania
90.8
/100
|
#138
Exceptional
5.4%
Belizeans
90.8
/100
|
#139
Exceptional
5.4%
Immigrants | Netherlands
90.5
/100
|
#140
Exceptional
5.4%
South American Indians
89.3
/100
|
#141
Excellent
5.5%
Colombians
88.0
/100
|
#142
Excellent
5.5%
Immigrants | Hungary
87.9
/100
|
#143
Excellent
5.5%
Pakistanis
87.3
/100
|
#144
Excellent
5.5%
Immigrants | Guatemala
86.6
/100
|
#145
Excellent
5.5%
Albanians
83.7
/100
|
#146
Excellent
5.5%
Immigrants | Albania
83.1
/100
|
#147
Excellent
5.5%
Samoans
81.9
/100
|
#148
Excellent
5.5%

Demographics Similar to French by Disability Age 5 to 17

In terms of disability age 5 to 17, the demographic groups most similar to French are Immigrants from Portugal (6.4%, a difference of 0.18%), Immigrants from Dominican Republic (6.4%, a difference of 0.36%), Kiowa (6.4%, a difference of 0.48%), Apache (6.4%, a difference of 0.51%), and Comanche (6.4%, a difference of 0.51%).
DemographicsRating | RankDisability Age 5 to 17
Bahamians
0.0
/100
|
#307
Tragic
6.3%
Scotch-Irish
0.0
/100
|
#308
Tragic
6.3%
Hmong
0.0
/100
|
#309
Tragic
6.3%
Alaskan Athabascans
0.0
/100
|
#310
Tragic
6.3%
Immigrants | Dominica
0.0
/100
|
#311
Tragic
6.3%
Bermudans
0.0
/100
|
#312
Tragic
6.4%
Apache
0.0
/100
|
#313
Tragic
6.4%
French
0.0
/100
|
#314
Tragic
6.4%
Immigrants | Portugal
0.0
/100
|
#315
Tragic
6.4%
Immigrants | Dominican Republic
0.0
/100
|
#316
Tragic
6.4%
Kiowa
0.0
/100
|
#317
Tragic
6.4%
Comanche
0.0
/100
|
#318
Tragic
6.4%
Delaware
0.0
/100
|
#319
Tragic
6.5%
Africans
0.0
/100
|
#320
Tragic
6.5%
Tohono O'odham
0.0
/100
|
#321
Tragic
6.5%