South African vs Ottawa Hearing Disability
COMPARE
South African
Ottawa
Hearing Disability
Hearing Disability Comparison
South Africans
Ottawa
3.1%
HEARING DISABILITY
24.5/ 100
METRIC RATING
194th/ 347
METRIC RANK
3.8%
HEARING DISABILITY
0.0/ 100
METRIC RATING
308th/ 347
METRIC RANK
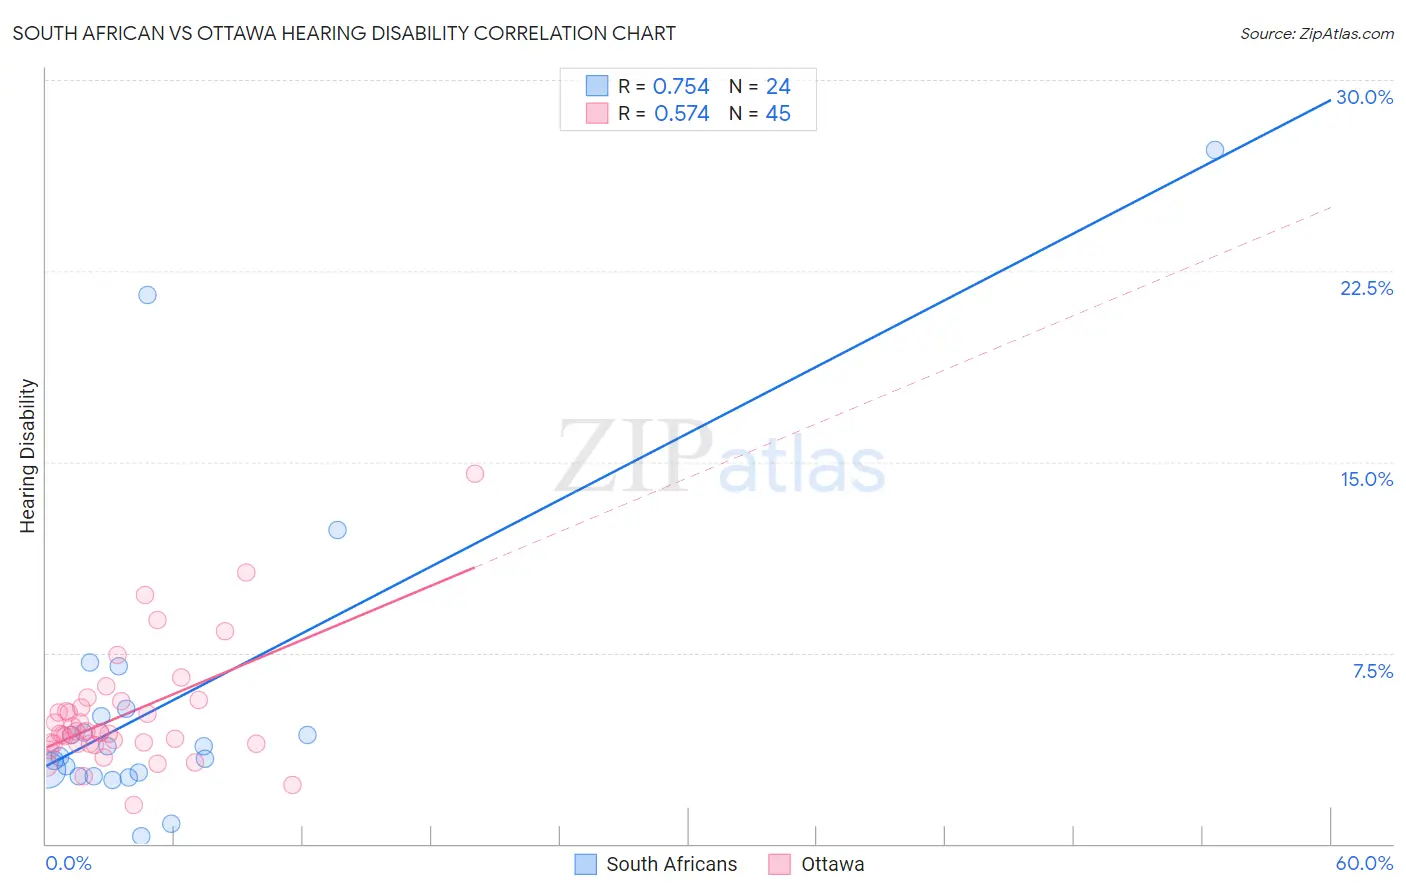
South African vs Ottawa Hearing Disability Correlation Chart
The statistical analysis conducted on geographies consisting of 182,558,615 people shows a strong positive correlation between the proportion of South Africans and percentage of population with hearing disability in the United States with a correlation coefficient (R) of 0.754 and weighted average of 3.1%. Similarly, the statistical analysis conducted on geographies consisting of 49,954,847 people shows a substantial positive correlation between the proportion of Ottawa and percentage of population with hearing disability in the United States with a correlation coefficient (R) of 0.574 and weighted average of 3.8%, a difference of 24.5%.
Hearing Disability Correlation Summary
| Measurement | South African | Ottawa |
| Minimum | 0.31% | 1.5% |
| Maximum | 27.3% | 14.5% |
| Range | 27.0% | 13.0% |
| Mean | 5.7% | 5.0% |
| Median | 3.6% | 4.4% |
| Interquartile 25% (IQ1) | 2.7% | 3.9% |
| Interquartile 75% (IQ3) | 5.2% | 5.5% |
| Interquartile Range (IQR) | 2.4% | 1.5% |
| Standard Deviation (Sample) | 6.3% | 2.3% |
| Standard Deviation (Population) | 6.2% | 2.3% |
Similar Demographics by Hearing Disability
Demographics Similar to South Africans by Hearing Disability
In terms of hearing disability, the demographic groups most similar to South Africans are Spanish American Indian (3.1%, a difference of 0.050%), Immigrants from Europe (3.1%, a difference of 0.21%), Macedonian (3.1%, a difference of 0.30%), Korean (3.1%, a difference of 0.37%), and Immigrants from Switzerland (3.1%, a difference of 0.51%).
| Demographics | Rating | Rank | Hearing Disability |
| Blacks/African Americans | 34.7 /100 | #187 | Fair 3.0% |
| Mexican American Indians | 34.7 /100 | #188 | Fair 3.0% |
| Africans | 32.9 /100 | #189 | Fair 3.0% |
| Immigrants | South Africa | 31.1 /100 | #190 | Fair 3.1% |
| Immigrants | Switzerland | 28.8 /100 | #191 | Fair 3.1% |
| Koreans | 27.6 /100 | #192 | Fair 3.1% |
| Macedonians | 27.0 /100 | #193 | Fair 3.1% |
| South Africans | 24.5 /100 | #194 | Fair 3.1% |
| Spanish American Indians | 24.1 /100 | #195 | Fair 3.1% |
| Immigrants | Europe | 22.9 /100 | #196 | Fair 3.1% |
| Immigrants | Bosnia and Herzegovina | 20.6 /100 | #197 | Fair 3.1% |
| Immigrants | Croatia | 20.5 /100 | #198 | Fair 3.1% |
| Syrians | 19.2 /100 | #199 | Poor 3.1% |
| Immigrants | North Macedonia | 19.1 /100 | #200 | Poor 3.1% |
| Iraqis | 19.0 /100 | #201 | Poor 3.1% |
Demographics Similar to Ottawa by Hearing Disability
In terms of hearing disability, the demographic groups most similar to Ottawa are Scotch-Irish (3.8%, a difference of 0.080%), Cree (3.8%, a difference of 0.39%), French Canadian (3.8%, a difference of 0.44%), Marshallese (3.8%, a difference of 0.56%), and English (3.8%, a difference of 1.4%).
| Demographics | Rating | Rank | Hearing Disability |
| Pennsylvania Germans | 0.0 /100 | #301 | Tragic 3.7% |
| Dutch | 0.0 /100 | #302 | Tragic 3.7% |
| Menominee | 0.0 /100 | #303 | Tragic 3.7% |
| French | 0.0 /100 | #304 | Tragic 3.8% |
| English | 0.0 /100 | #305 | Tragic 3.8% |
| Marshallese | 0.0 /100 | #306 | Tragic 3.8% |
| French Canadians | 0.0 /100 | #307 | Tragic 3.8% |
| Ottawa | 0.0 /100 | #308 | Tragic 3.8% |
| Scotch-Irish | 0.0 /100 | #309 | Tragic 3.8% |
| Cree | 0.0 /100 | #310 | Tragic 3.8% |
| Americans | 0.0 /100 | #311 | Tragic 3.9% |
| Cajuns | 0.0 /100 | #312 | Tragic 3.9% |
| Hopi | 0.0 /100 | #313 | Tragic 3.9% |
| Yakama | 0.0 /100 | #314 | Tragic 3.9% |
| Puget Sound Salish | 0.0 /100 | #315 | Tragic 3.9% |