Somali vs Vietnamese Disability Age Under 5
COMPARE
Somali
Vietnamese
Disability Age Under 5
Disability Age Under 5 Comparison
Somalis
Vietnamese
1.2%
DISABILITY AGE UNDER 5
80.8/ 100
METRIC RATING
140th/ 347
METRIC RANK
0.81%
DISABILITY AGE UNDER 5
100.0/ 100
METRIC RATING
3rd/ 347
METRIC RANK
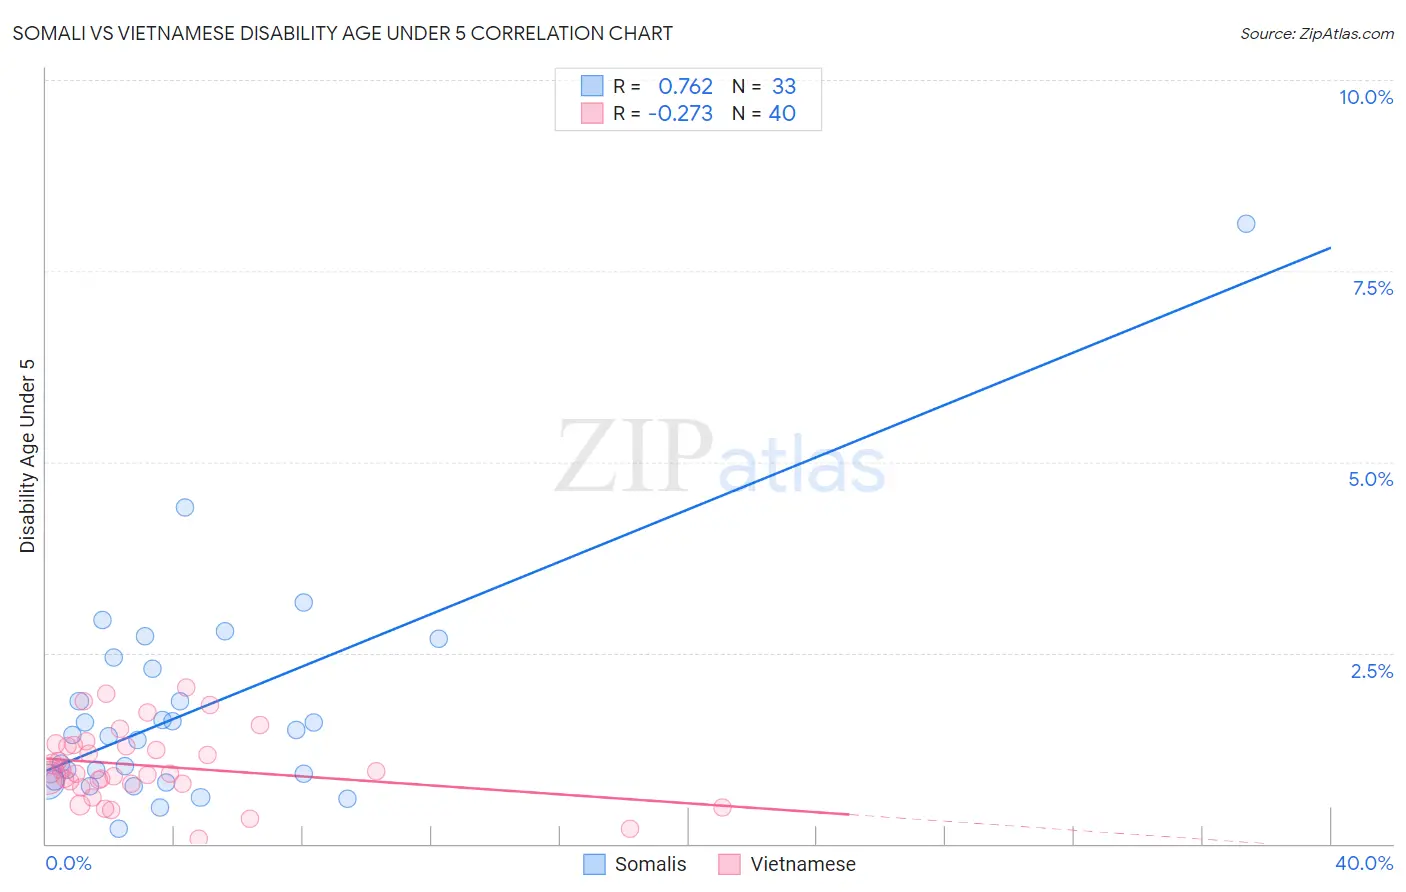
Somali vs Vietnamese Disability Age Under 5 Correlation Chart
The statistical analysis conducted on geographies consisting of 79,099,186 people shows a strong positive correlation between the proportion of Somalis and percentage of population with a disability under the age of 5 in the United States with a correlation coefficient (R) of 0.762 and weighted average of 1.2%. Similarly, the statistical analysis conducted on geographies consisting of 116,197,167 people shows a weak negative correlation between the proportion of Vietnamese and percentage of population with a disability under the age of 5 in the United States with a correlation coefficient (R) of -0.273 and weighted average of 0.81%, a difference of 47.8%.
Disability Age Under 5 Correlation Summary
| Measurement | Somali | Vietnamese |
| Minimum | 0.20% | 0.070% |
| Maximum | 8.1% | 2.0% |
| Range | 7.9% | 2.0% |
| Mean | 1.8% | 1.0% |
| Median | 1.4% | 0.93% |
| Interquartile 25% (IQ1) | 0.82% | 0.79% |
| Interquartile 75% (IQ3) | 2.4% | 1.3% |
| Interquartile Range (IQR) | 1.5% | 0.50% |
| Standard Deviation (Sample) | 1.5% | 0.47% |
| Standard Deviation (Population) | 1.5% | 0.46% |
Similar Demographics by Disability Age Under 5
Demographics Similar to Somalis by Disability Age Under 5
In terms of disability age under 5, the demographic groups most similar to Somalis are Immigrants from Honduras (1.2%, a difference of 0.060%), New Zealander (1.2%, a difference of 0.090%), Immigrants from Colombia (1.2%, a difference of 0.21%), Alsatian (1.2%, a difference of 0.22%), and Immigrants from Middle Africa (1.2%, a difference of 0.22%).
| Demographics | Rating | Rank | Disability Age Under 5 |
| Immigrants | Spain | 86.5 /100 | #133 | Excellent 1.2% |
| Argentineans | 85.7 /100 | #134 | Excellent 1.2% |
| Fijians | 84.7 /100 | #135 | Excellent 1.2% |
| Moroccans | 83.6 /100 | #136 | Excellent 1.2% |
| Immigrants | Eastern Africa | 83.1 /100 | #137 | Excellent 1.2% |
| Immigrants | Czechoslovakia | 82.8 /100 | #138 | Excellent 1.2% |
| New Zealanders | 81.4 /100 | #139 | Excellent 1.2% |
| Somalis | 80.8 /100 | #140 | Excellent 1.2% |
| Immigrants | Honduras | 80.4 /100 | #141 | Excellent 1.2% |
| Immigrants | Colombia | 79.3 /100 | #142 | Good 1.2% |
| Alsatians | 79.3 /100 | #143 | Good 1.2% |
| Immigrants | Middle Africa | 79.3 /100 | #144 | Good 1.2% |
| Immigrants | Zimbabwe | 77.9 /100 | #145 | Good 1.2% |
| Samoans | 77.7 /100 | #146 | Good 1.2% |
| Icelanders | 76.3 /100 | #147 | Good 1.2% |
Demographics Similar to Vietnamese by Disability Age Under 5
In terms of disability age under 5, the demographic groups most similar to Vietnamese are Immigrants from St. Vincent and the Grenadines (0.79%, a difference of 3.2%), Immigrants from Uzbekistan (0.85%, a difference of 4.6%), Immigrants from Bangladesh (0.85%, a difference of 5.0%), Ute (0.86%, a difference of 6.0%), and Immigrants from Armenia (0.76%, a difference of 7.4%).
| Demographics | Rating | Rank | Disability Age Under 5 |
| Immigrants | Armenia | 100.0 /100 | #1 | Exceptional 0.76% |
| Immigrants | St. Vincent and the Grenadines | 100.0 /100 | #2 | Exceptional 0.79% |
| Vietnamese | 100.0 /100 | #3 | Exceptional 0.81% |
| Immigrants | Uzbekistan | 100.0 /100 | #4 | Exceptional 0.85% |
| Immigrants | Bangladesh | 100.0 /100 | #5 | Exceptional 0.85% |
| Ute | 100.0 /100 | #6 | Exceptional 0.86% |
| Immigrants | Afghanistan | 100.0 /100 | #7 | Exceptional 0.91% |
| Immigrants | Yemen | 100.0 /100 | #8 | Exceptional 0.91% |
| Immigrants | Fiji | 100.0 /100 | #9 | Exceptional 0.92% |
| Marshallese | 100.0 /100 | #10 | Exceptional 0.94% |
| Afghans | 100.0 /100 | #11 | Exceptional 0.94% |
| Immigrants | Grenada | 100.0 /100 | #12 | Exceptional 0.94% |
| Soviet Union | 100.0 /100 | #13 | Exceptional 0.95% |
| Yuman | 100.0 /100 | #14 | Exceptional 0.95% |
| Immigrants | Hong Kong | 100.0 /100 | #15 | Exceptional 0.95% |