Immigrants from Oceania vs Vietnamese Disability Age Under 5
COMPARE
Immigrants from Oceania
Vietnamese
Disability Age Under 5
Disability Age Under 5 Comparison
Immigrants from Oceania
Vietnamese
1.2%
DISABILITY AGE UNDER 5
94.2/ 100
METRIC RATING
113th/ 347
METRIC RANK
0.81%
DISABILITY AGE UNDER 5
100.0/ 100
METRIC RATING
3rd/ 347
METRIC RANK
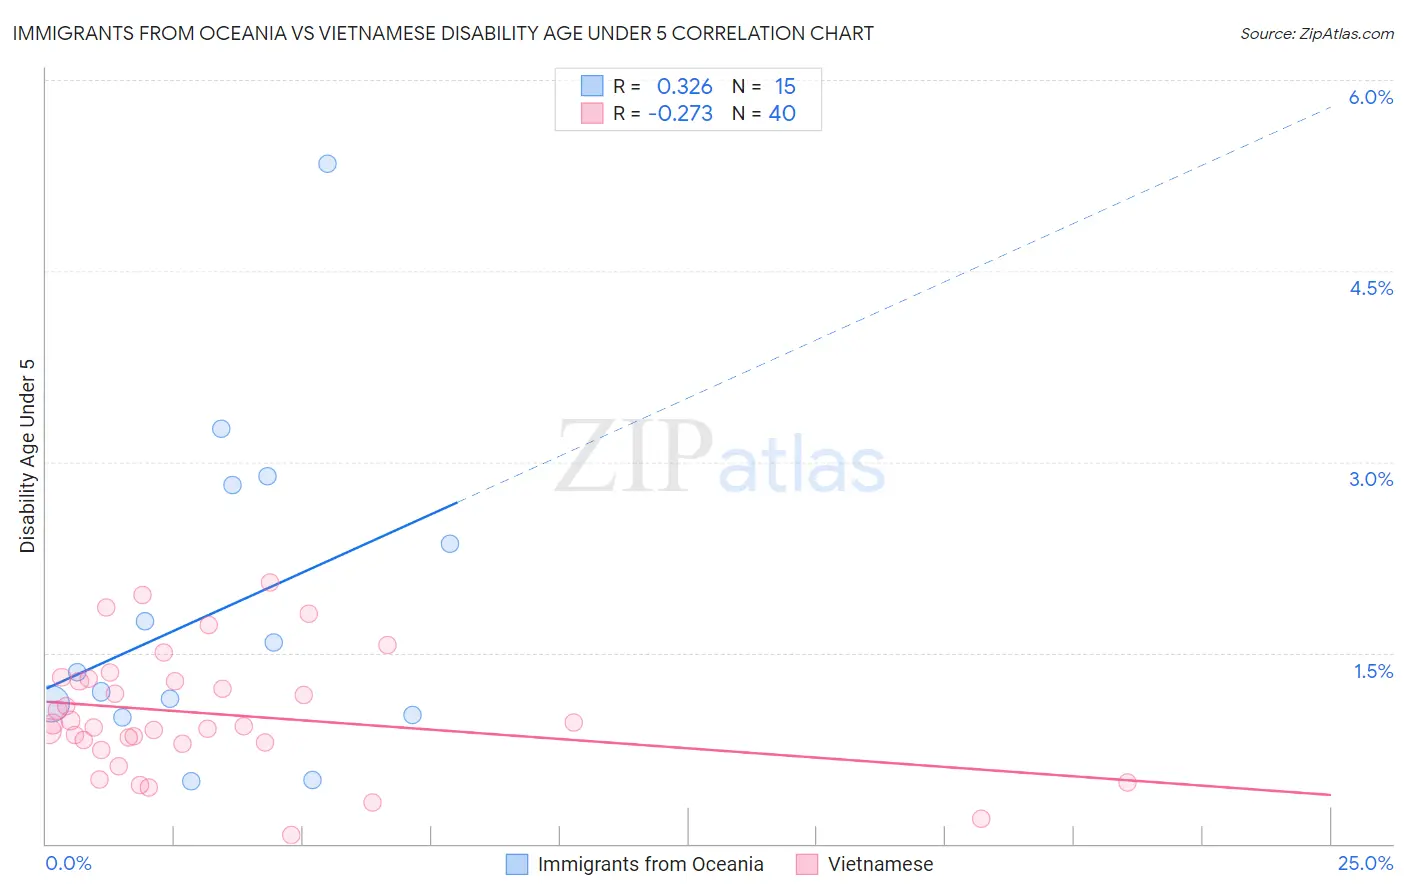
Immigrants from Oceania vs Vietnamese Disability Age Under 5 Correlation Chart
The statistical analysis conducted on geographies consisting of 180,365,611 people shows a mild positive correlation between the proportion of Immigrants from Oceania and percentage of population with a disability under the age of 5 in the United States with a correlation coefficient (R) of 0.326 and weighted average of 1.2%. Similarly, the statistical analysis conducted on geographies consisting of 116,197,167 people shows a weak negative correlation between the proportion of Vietnamese and percentage of population with a disability under the age of 5 in the United States with a correlation coefficient (R) of -0.273 and weighted average of 0.81%, a difference of 43.1%.
Disability Age Under 5 Correlation Summary
| Measurement | Immigrants from Oceania | Vietnamese |
| Minimum | 0.49% | 0.070% |
| Maximum | 5.3% | 2.0% |
| Range | 4.9% | 2.0% |
| Mean | 1.9% | 1.0% |
| Median | 1.3% | 0.93% |
| Interquartile 25% (IQ1) | 1.0% | 0.79% |
| Interquartile 75% (IQ3) | 2.8% | 1.3% |
| Interquartile Range (IQR) | 1.8% | 0.50% |
| Standard Deviation (Sample) | 1.3% | 0.47% |
| Standard Deviation (Population) | 1.2% | 0.46% |
Similar Demographics by Disability Age Under 5
Demographics Similar to Immigrants from Oceania by Disability Age Under 5
In terms of disability age under 5, the demographic groups most similar to Immigrants from Oceania are Immigrants from Australia (1.2%, a difference of 0.060%), Belizean (1.2%, a difference of 0.15%), Immigrants from Caribbean (1.2%, a difference of 0.16%), Senegalese (1.2%, a difference of 0.17%), and Immigrants from Northern Africa (1.2%, a difference of 0.18%).
| Demographics | Rating | Rank | Disability Age Under 5 |
| Cambodians | 95.4 /100 | #106 | Exceptional 1.2% |
| Immigrants | West Indies | 95.3 /100 | #107 | Exceptional 1.2% |
| Iraqis | 95.1 /100 | #108 | Exceptional 1.2% |
| Immigrants | Panama | 95.0 /100 | #109 | Exceptional 1.2% |
| Immigrants | Lebanon | 95.0 /100 | #110 | Exceptional 1.2% |
| Senegalese | 94.6 /100 | #111 | Exceptional 1.2% |
| Immigrants | Australia | 94.4 /100 | #112 | Exceptional 1.2% |
| Immigrants | Oceania | 94.2 /100 | #113 | Exceptional 1.2% |
| Belizeans | 93.9 /100 | #114 | Exceptional 1.2% |
| Immigrants | Caribbean | 93.8 /100 | #115 | Exceptional 1.2% |
| Immigrants | Northern Africa | 93.8 /100 | #116 | Exceptional 1.2% |
| Immigrants | Philippines | 93.5 /100 | #117 | Exceptional 1.2% |
| Immigrants | Venezuela | 93.4 /100 | #118 | Exceptional 1.2% |
| Bhutanese | 92.5 /100 | #119 | Exceptional 1.2% |
| Immigrants | Eritrea | 92.3 /100 | #120 | Exceptional 1.2% |
Demographics Similar to Vietnamese by Disability Age Under 5
In terms of disability age under 5, the demographic groups most similar to Vietnamese are Immigrants from St. Vincent and the Grenadines (0.79%, a difference of 3.2%), Immigrants from Uzbekistan (0.85%, a difference of 4.6%), Immigrants from Bangladesh (0.85%, a difference of 5.0%), Ute (0.86%, a difference of 6.0%), and Immigrants from Armenia (0.76%, a difference of 7.4%).
| Demographics | Rating | Rank | Disability Age Under 5 |
| Immigrants | Armenia | 100.0 /100 | #1 | Exceptional 0.76% |
| Immigrants | St. Vincent and the Grenadines | 100.0 /100 | #2 | Exceptional 0.79% |
| Vietnamese | 100.0 /100 | #3 | Exceptional 0.81% |
| Immigrants | Uzbekistan | 100.0 /100 | #4 | Exceptional 0.85% |
| Immigrants | Bangladesh | 100.0 /100 | #5 | Exceptional 0.85% |
| Ute | 100.0 /100 | #6 | Exceptional 0.86% |
| Immigrants | Afghanistan | 100.0 /100 | #7 | Exceptional 0.91% |
| Immigrants | Yemen | 100.0 /100 | #8 | Exceptional 0.91% |
| Immigrants | Fiji | 100.0 /100 | #9 | Exceptional 0.92% |
| Marshallese | 100.0 /100 | #10 | Exceptional 0.94% |
| Afghans | 100.0 /100 | #11 | Exceptional 0.94% |
| Immigrants | Grenada | 100.0 /100 | #12 | Exceptional 0.94% |
| Soviet Union | 100.0 /100 | #13 | Exceptional 0.95% |
| Yuman | 100.0 /100 | #14 | Exceptional 0.95% |
| Immigrants | Hong Kong | 100.0 /100 | #15 | Exceptional 0.95% |