Immigrants from Iran vs Vietnamese Disability Age Under 5
COMPARE
Immigrants from Iran
Vietnamese
Disability Age Under 5
Disability Age Under 5 Comparison
Immigrants from Iran
Vietnamese
1.00%
DISABILITY AGE UNDER 5
100.0/ 100
METRIC RATING
22nd/ 347
METRIC RANK
0.81%
DISABILITY AGE UNDER 5
100.0/ 100
METRIC RATING
3rd/ 347
METRIC RANK
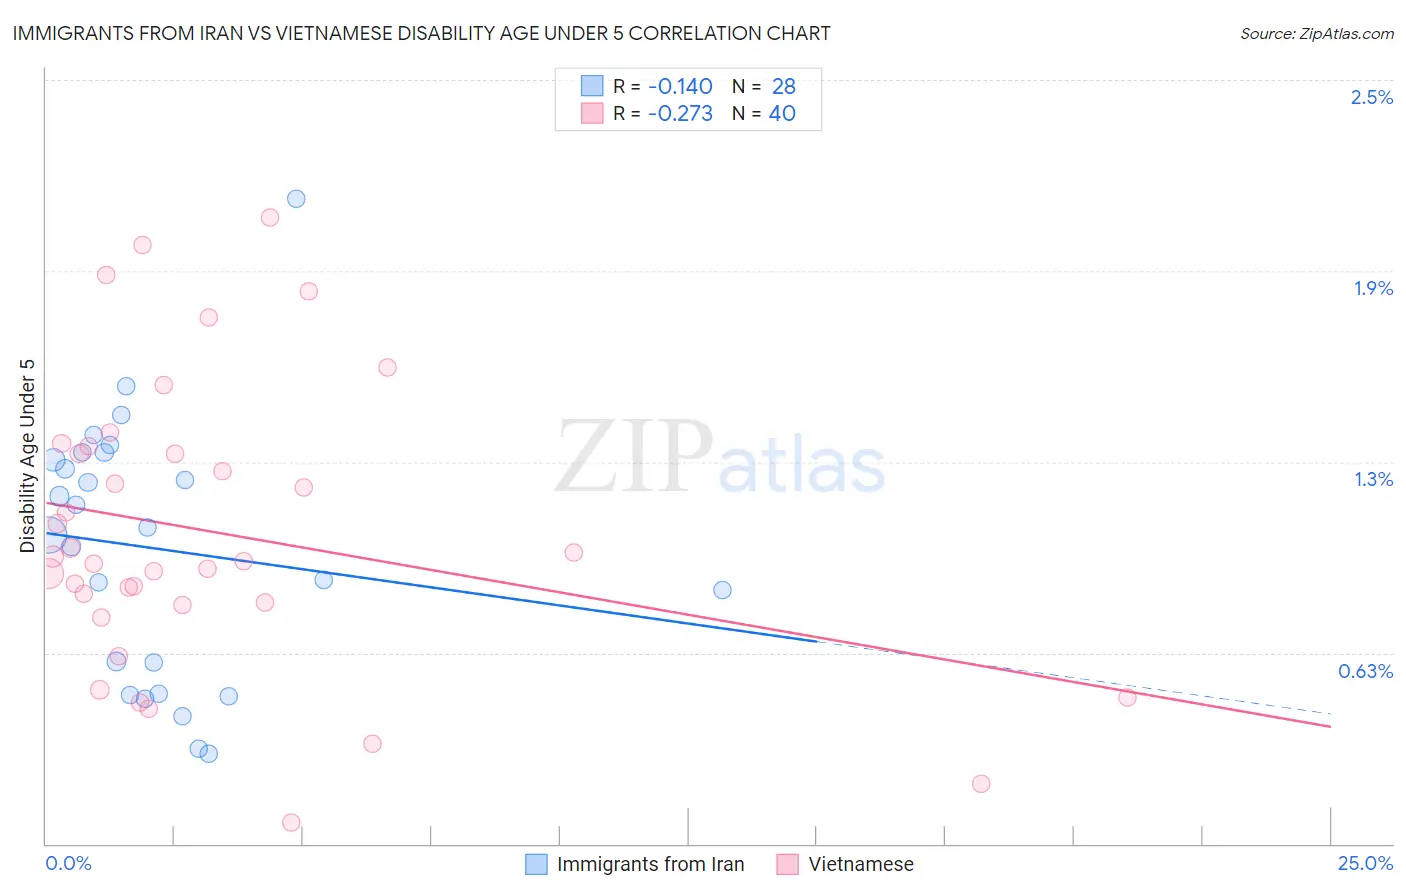
Immigrants from Iran vs Vietnamese Disability Age Under 5 Correlation Chart
The statistical analysis conducted on geographies consisting of 168,672,244 people shows a poor negative correlation between the proportion of Immigrants from Iran and percentage of population with a disability under the age of 5 in the United States with a correlation coefficient (R) of -0.140 and weighted average of 1.00%. Similarly, the statistical analysis conducted on geographies consisting of 116,197,167 people shows a weak negative correlation between the proportion of Vietnamese and percentage of population with a disability under the age of 5 in the United States with a correlation coefficient (R) of -0.273 and weighted average of 0.81%, a difference of 23.0%.
Disability Age Under 5 Correlation Summary
| Measurement | Immigrants from Iran | Vietnamese |
| Minimum | 0.30% | 0.070% |
| Maximum | 2.1% | 2.0% |
| Range | 1.8% | 2.0% |
| Mean | 0.97% | 1.0% |
| Median | 1.0% | 0.93% |
| Interquartile 25% (IQ1) | 0.54% | 0.79% |
| Interquartile 75% (IQ3) | 1.3% | 1.3% |
| Interquartile Range (IQR) | 0.73% | 0.50% |
| Standard Deviation (Sample) | 0.43% | 0.47% |
| Standard Deviation (Population) | 0.42% | 0.46% |
Demographics Similar to Immigrants from Iran and Vietnamese by Disability Age Under 5
In terms of disability age under 5, the demographic groups most similar to Immigrants from Iran are British West Indian (0.99%, a difference of 0.79%), Nepalese (0.97%, a difference of 2.6%), Puget Sound Salish (0.97%, a difference of 2.7%), Immigrants from Barbados (0.97%, a difference of 3.1%), and Immigrants from China (0.96%, a difference of 3.7%). Similarly, the demographic groups most similar to Vietnamese are Immigrants from St. Vincent and the Grenadines (0.79%, a difference of 3.2%), Immigrants from Uzbekistan (0.85%, a difference of 4.6%), Immigrants from Bangladesh (0.85%, a difference of 5.0%), Ute (0.86%, a difference of 6.0%), and Immigrants from Afghanistan (0.91%, a difference of 11.6%).
| Demographics | Rating | Rank | Disability Age Under 5 |
| Immigrants | St. Vincent and the Grenadines | 100.0 /100 | #2 | Exceptional 0.79% |
| Vietnamese | 100.0 /100 | #3 | Exceptional 0.81% |
| Immigrants | Uzbekistan | 100.0 /100 | #4 | Exceptional 0.85% |
| Immigrants | Bangladesh | 100.0 /100 | #5 | Exceptional 0.85% |
| Ute | 100.0 /100 | #6 | Exceptional 0.86% |
| Immigrants | Afghanistan | 100.0 /100 | #7 | Exceptional 0.91% |
| Immigrants | Yemen | 100.0 /100 | #8 | Exceptional 0.91% |
| Immigrants | Fiji | 100.0 /100 | #9 | Exceptional 0.92% |
| Marshallese | 100.0 /100 | #10 | Exceptional 0.94% |
| Afghans | 100.0 /100 | #11 | Exceptional 0.94% |
| Immigrants | Grenada | 100.0 /100 | #12 | Exceptional 0.94% |
| Soviet Union | 100.0 /100 | #13 | Exceptional 0.95% |
| Yuman | 100.0 /100 | #14 | Exceptional 0.95% |
| Immigrants | Hong Kong | 100.0 /100 | #15 | Exceptional 0.95% |
| Immigrants | Israel | 100.0 /100 | #16 | Exceptional 0.96% |
| Immigrants | China | 100.0 /100 | #17 | Exceptional 0.96% |
| Immigrants | Barbados | 100.0 /100 | #18 | Exceptional 0.97% |
| Puget Sound Salish | 100.0 /100 | #19 | Exceptional 0.97% |
| Nepalese | 100.0 /100 | #20 | Exceptional 0.97% |
| British West Indians | 100.0 /100 | #21 | Exceptional 0.99% |
| Immigrants | Iran | 100.0 /100 | #22 | Exceptional 1.00% |