Somali vs Immigrants from Eritrea Disability Age Under 5
COMPARE
Somali
Immigrants from Eritrea
Disability Age Under 5
Disability Age Under 5 Comparison
Somalis
Immigrants from Eritrea
1.2%
DISABILITY AGE UNDER 5
80.8/ 100
METRIC RATING
140th/ 347
METRIC RANK
1.2%
DISABILITY AGE UNDER 5
92.3/ 100
METRIC RATING
120th/ 347
METRIC RANK
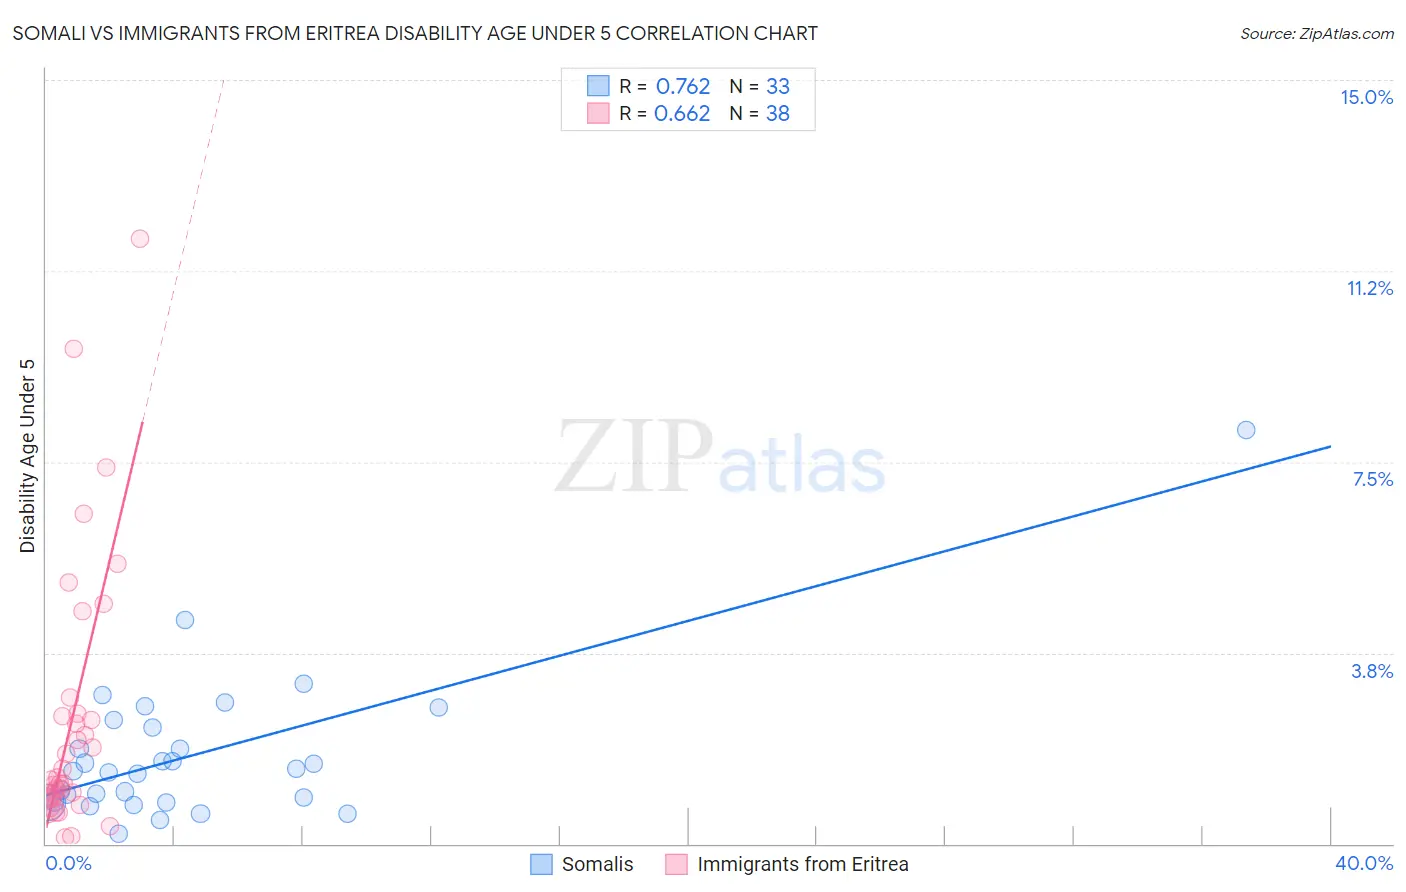
Somali vs Immigrants from Eritrea Disability Age Under 5 Correlation Chart
The statistical analysis conducted on geographies consisting of 79,099,186 people shows a strong positive correlation between the proportion of Somalis and percentage of population with a disability under the age of 5 in the United States with a correlation coefficient (R) of 0.762 and weighted average of 1.2%. Similarly, the statistical analysis conducted on geographies consisting of 83,045,711 people shows a significant positive correlation between the proportion of Immigrants from Eritrea and percentage of population with a disability under the age of 5 in the United States with a correlation coefficient (R) of 0.662 and weighted average of 1.2%, a difference of 2.5%.
Disability Age Under 5 Correlation Summary
| Measurement | Somali | Immigrants from Eritrea |
| Minimum | 0.20% | 0.12% |
| Maximum | 8.1% | 11.9% |
| Range | 7.9% | 11.8% |
| Mean | 1.8% | 2.5% |
| Median | 1.4% | 1.3% |
| Interquartile 25% (IQ1) | 0.82% | 0.90% |
| Interquartile 75% (IQ3) | 2.4% | 2.5% |
| Interquartile Range (IQR) | 1.5% | 1.6% |
| Standard Deviation (Sample) | 1.5% | 2.7% |
| Standard Deviation (Population) | 1.5% | 2.6% |
Demographics Similar to Somalis and Immigrants from Eritrea by Disability Age Under 5
In terms of disability age under 5, the demographic groups most similar to Somalis are New Zealander (1.2%, a difference of 0.090%), Immigrants from Czechoslovakia (1.2%, a difference of 0.32%), Immigrants from Eastern Africa (1.2%, a difference of 0.37%), Moroccan (1.2%, a difference of 0.46%), and Fijian (1.2%, a difference of 0.64%). Similarly, the demographic groups most similar to Immigrants from Eritrea are Immigrants from Senegal (1.2%, a difference of 0.28%), Aleut (1.2%, a difference of 0.47%), Zimbabwean (1.2%, a difference of 0.52%), Immigrants from Cambodia (1.2%, a difference of 0.54%), and Japanese (1.2%, a difference of 0.60%).
| Demographics | Rating | Rank | Disability Age Under 5 |
| Immigrants | Eritrea | 92.3 /100 | #120 | Exceptional 1.2% |
| Immigrants | Senegal | 91.4 /100 | #121 | Exceptional 1.2% |
| Aleuts | 90.7 /100 | #122 | Exceptional 1.2% |
| Zimbabweans | 90.6 /100 | #123 | Exceptional 1.2% |
| Immigrants | Cambodia | 90.5 /100 | #124 | Exceptional 1.2% |
| Japanese | 90.3 /100 | #125 | Exceptional 1.2% |
| Central Americans | 89.7 /100 | #126 | Excellent 1.2% |
| Immigrants | Romania | 88.4 /100 | #127 | Excellent 1.2% |
| Immigrants | France | 88.4 /100 | #128 | Excellent 1.2% |
| Immigrants | Immigrants | 88.0 /100 | #129 | Excellent 1.2% |
| Koreans | 87.7 /100 | #130 | Excellent 1.2% |
| Immigrants | Serbia | 87.6 /100 | #131 | Excellent 1.2% |
| Immigrants | Eastern Europe | 87.3 /100 | #132 | Excellent 1.2% |
| Immigrants | Spain | 86.5 /100 | #133 | Excellent 1.2% |
| Argentineans | 85.7 /100 | #134 | Excellent 1.2% |
| Fijians | 84.7 /100 | #135 | Excellent 1.2% |
| Moroccans | 83.6 /100 | #136 | Excellent 1.2% |
| Immigrants | Eastern Africa | 83.1 /100 | #137 | Excellent 1.2% |
| Immigrants | Czechoslovakia | 82.8 /100 | #138 | Excellent 1.2% |
| New Zealanders | 81.4 /100 | #139 | Excellent 1.2% |
| Somalis | 80.8 /100 | #140 | Excellent 1.2% |