Somali vs Vietnamese Births to Unmarried Women
COMPARE
Somali
Vietnamese
Births to Unmarried Women
Births to Unmarried Women Comparison
Somalis
Vietnamese
30.7%
BIRTHS TO UNMARRIED WOMEN
77.8/ 100
METRIC RATING
150th/ 347
METRIC RANK
30.2%
BIRTHS TO UNMARRIED WOMEN
87.7/ 100
METRIC RATING
125th/ 347
METRIC RANK
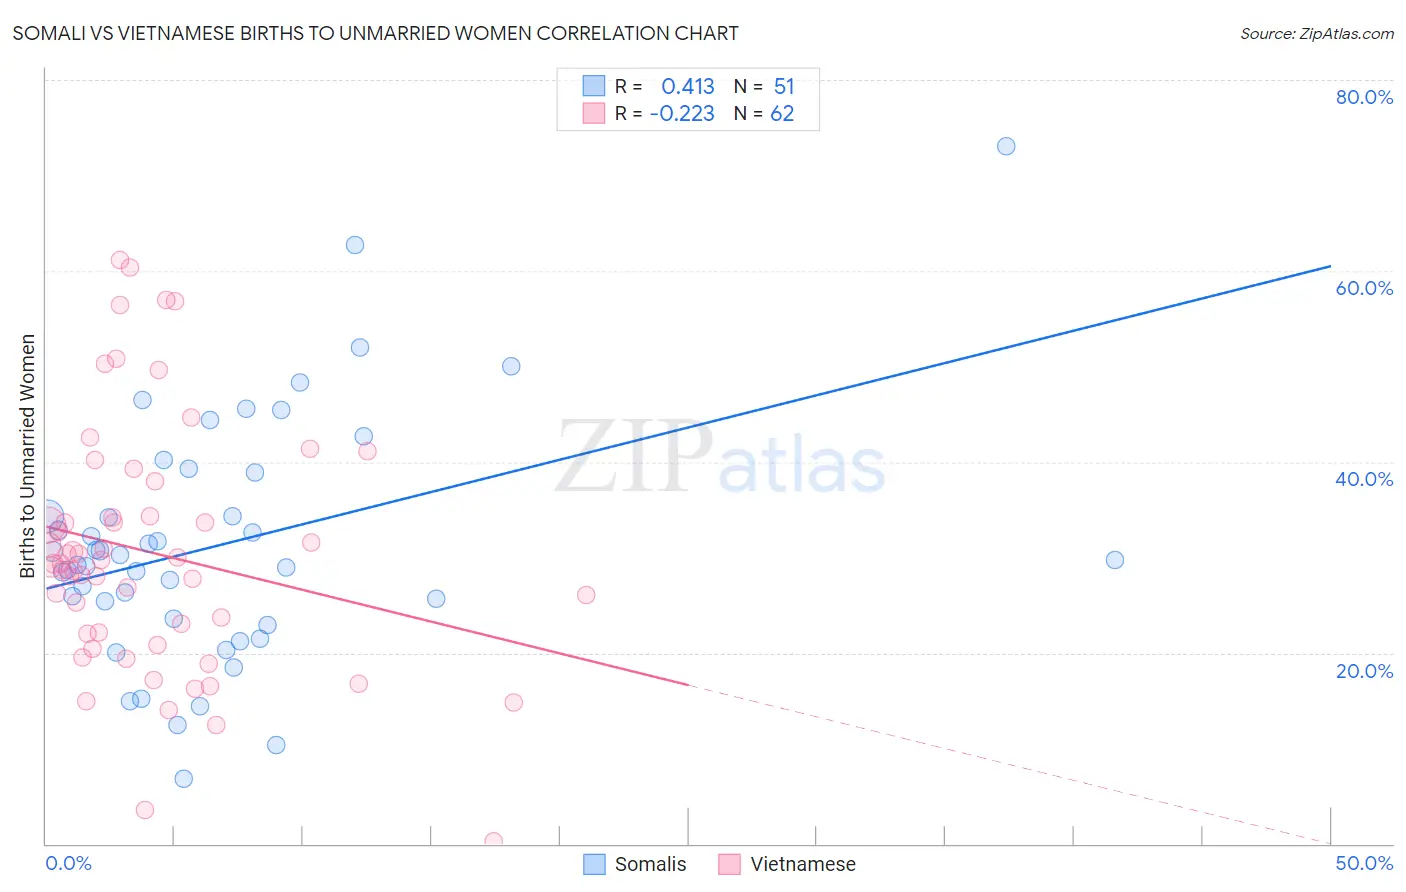
Somali vs Vietnamese Births to Unmarried Women Correlation Chart
The statistical analysis conducted on geographies consisting of 97,449,396 people shows a moderate positive correlation between the proportion of Somalis and percentage of births to unmarried women in the United States with a correlation coefficient (R) of 0.413 and weighted average of 30.7%. Similarly, the statistical analysis conducted on geographies consisting of 164,695,989 people shows a weak negative correlation between the proportion of Vietnamese and percentage of births to unmarried women in the United States with a correlation coefficient (R) of -0.223 and weighted average of 30.2%, a difference of 1.8%.
Births to Unmarried Women Correlation Summary
| Measurement | Somali | Vietnamese |
| Minimum | 6.8% | 0.20% |
| Maximum | 73.0% | 61.1% |
| Range | 66.2% | 60.9% |
| Mean | 31.3% | 30.5% |
| Median | 29.7% | 29.3% |
| Interquartile 25% (IQ1) | 23.6% | 22.0% |
| Interquartile 75% (IQ3) | 39.0% | 34.3% |
| Interquartile Range (IQR) | 15.4% | 12.3% |
| Standard Deviation (Sample) | 12.7% | 13.0% |
| Standard Deviation (Population) | 12.6% | 12.9% |
Similar Demographics by Births to Unmarried Women
Demographics Similar to Somalis by Births to Unmarried Women
In terms of births to unmarried women, the demographic groups most similar to Somalis are Italian (30.8%, a difference of 0.11%), Serbian (30.7%, a difference of 0.14%), Chilean (30.7%, a difference of 0.19%), Polish (30.8%, a difference of 0.22%), and British (30.8%, a difference of 0.24%).
| Demographics | Rating | Rank | Births to Unmarried Women |
| Immigrants | Uganda | 82.6 /100 | #143 | Excellent 30.5% |
| Czechs | 82.1 /100 | #144 | Excellent 30.5% |
| Immigrants | North America | 81.5 /100 | #145 | Excellent 30.6% |
| Northern Europeans | 81.4 /100 | #146 | Excellent 30.6% |
| Immigrants | Oceania | 81.2 /100 | #147 | Excellent 30.6% |
| Chileans | 79.1 /100 | #148 | Good 30.7% |
| Serbians | 78.8 /100 | #149 | Good 30.7% |
| Somalis | 77.8 /100 | #150 | Good 30.7% |
| Italians | 77.0 /100 | #151 | Good 30.8% |
| Poles | 76.2 /100 | #152 | Good 30.8% |
| British | 76.0 /100 | #153 | Good 30.8% |
| Yugoslavians | 75.1 /100 | #154 | Good 30.8% |
| Immigrants | Bangladesh | 73.9 /100 | #155 | Good 30.9% |
| Carpatho Rusyns | 73.5 /100 | #156 | Good 30.9% |
| Immigrants | Eastern Africa | 72.1 /100 | #157 | Good 31.0% |
Demographics Similar to Vietnamese by Births to Unmarried Women
In terms of births to unmarried women, the demographic groups most similar to Vietnamese are Croatian (30.2%, a difference of 0.070%), Syrian (30.2%, a difference of 0.11%), European (30.2%, a difference of 0.12%), Chinese (30.2%, a difference of 0.14%), and Immigrants from Argentina (30.1%, a difference of 0.24%).
| Demographics | Rating | Rank | Births to Unmarried Women |
| Immigrants | Norway | 91.0 /100 | #118 | Exceptional 29.9% |
| Argentineans | 90.5 /100 | #119 | Exceptional 30.0% |
| Ugandans | 89.2 /100 | #120 | Excellent 30.1% |
| Koreans | 88.9 /100 | #121 | Excellent 30.1% |
| Immigrants | Argentina | 88.7 /100 | #122 | Excellent 30.1% |
| Syrians | 88.2 /100 | #123 | Excellent 30.2% |
| Croatians | 88.0 /100 | #124 | Excellent 30.2% |
| Vietnamese | 87.7 /100 | #125 | Excellent 30.2% |
| Europeans | 87.2 /100 | #126 | Excellent 30.2% |
| Chinese | 87.1 /100 | #127 | Excellent 30.2% |
| Icelanders | 86.0 /100 | #128 | Excellent 30.3% |
| Immigrants | Spain | 85.8 /100 | #129 | Excellent 30.3% |
| Immigrants | Bosnia and Herzegovina | 85.7 /100 | #130 | Excellent 30.3% |
| Immigrants | Zimbabwe | 85.7 /100 | #131 | Excellent 30.3% |
| New Zealanders | 85.5 /100 | #132 | Excellent 30.3% |