Somali vs Iroquois Ambulatory Disability
COMPARE
Somali
Iroquois
Ambulatory Disability
Ambulatory Disability Comparison
Somalis
Iroquois
5.7%
AMBULATORY DISABILITY
99.2/ 100
METRIC RATING
78th/ 347
METRIC RANK
7.1%
AMBULATORY DISABILITY
0.0/ 100
METRIC RATING
306th/ 347
METRIC RANK
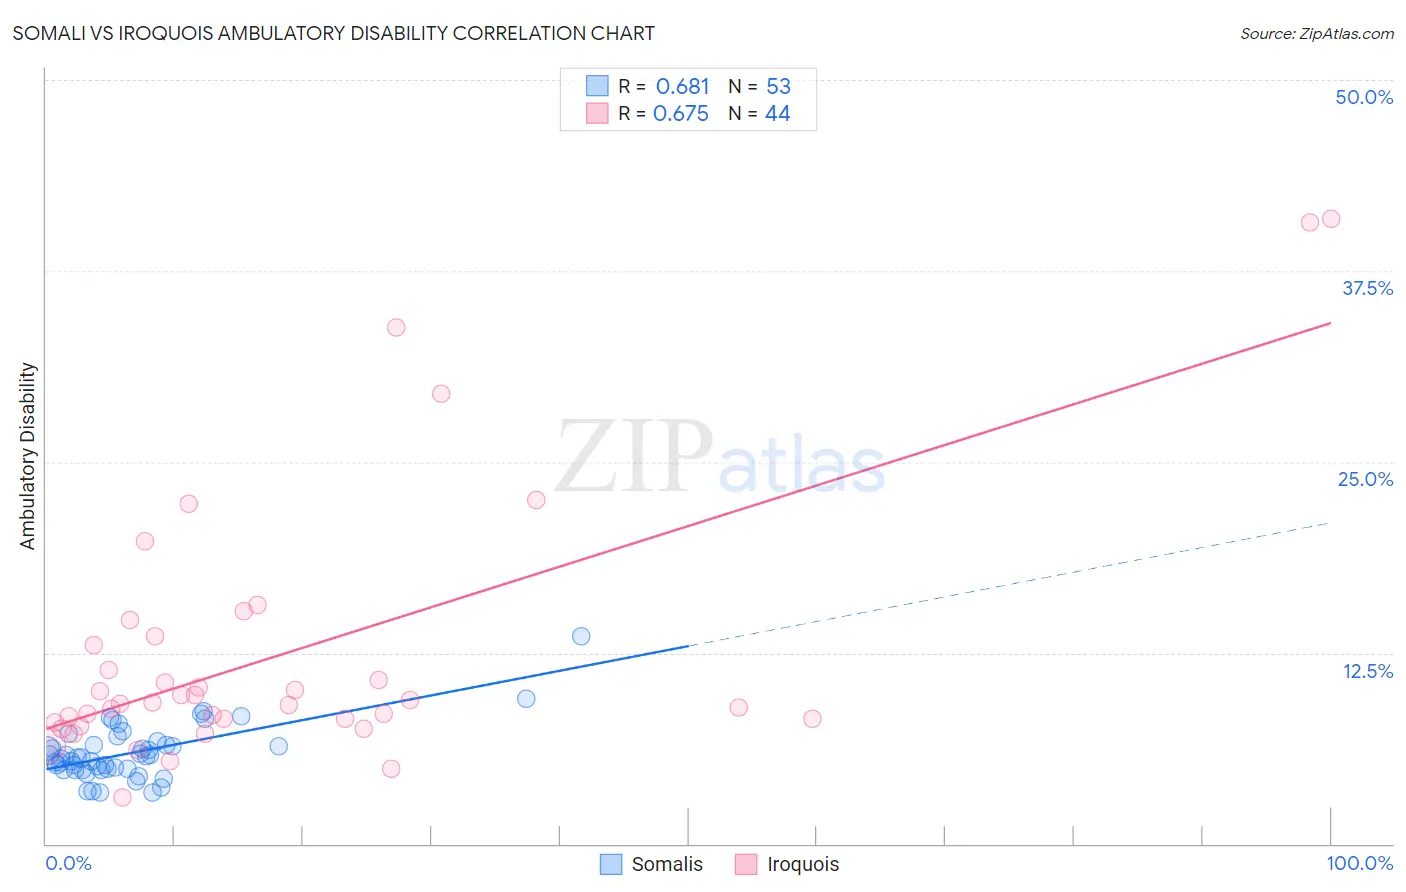
Somali vs Iroquois Ambulatory Disability Correlation Chart
The statistical analysis conducted on geographies consisting of 99,294,852 people shows a significant positive correlation between the proportion of Somalis and percentage of population with ambulatory disability in the United States with a correlation coefficient (R) of 0.681 and weighted average of 5.7%. Similarly, the statistical analysis conducted on geographies consisting of 207,272,935 people shows a significant positive correlation between the proportion of Iroquois and percentage of population with ambulatory disability in the United States with a correlation coefficient (R) of 0.675 and weighted average of 7.1%, a difference of 23.3%.
Ambulatory Disability Correlation Summary
| Measurement | Somali | Iroquois |
| Minimum | 3.3% | 3.0% |
| Maximum | 13.6% | 40.9% |
| Range | 10.2% | 37.9% |
| Mean | 6.0% | 12.5% |
| Median | 5.7% | 9.2% |
| Interquartile 25% (IQ1) | 4.9% | 8.0% |
| Interquartile 75% (IQ3) | 6.6% | 13.3% |
| Interquartile Range (IQR) | 1.7% | 5.2% |
| Standard Deviation (Sample) | 1.8% | 8.7% |
| Standard Deviation (Population) | 1.8% | 8.6% |
Similar Demographics by Ambulatory Disability
Demographics Similar to Somalis by Ambulatory Disability
In terms of ambulatory disability, the demographic groups most similar to Somalis are Immigrants from Vietnam (5.7%, a difference of 0.010%), Chilean (5.7%, a difference of 0.010%), Immigrants from Ireland (5.7%, a difference of 0.14%), Immigrants from Jordan (5.7%, a difference of 0.14%), and Palestinian (5.7%, a difference of 0.15%).
| Demographics | Rating | Rank | Ambulatory Disability |
| Immigrants | Peru | 99.4 /100 | #71 | Exceptional 5.7% |
| Brazilians | 99.4 /100 | #72 | Exceptional 5.7% |
| Immigrants | Northern Africa | 99.4 /100 | #73 | Exceptional 5.7% |
| Immigrants | Cameroon | 99.4 /100 | #74 | Exceptional 5.7% |
| Immigrants | South Africa | 99.3 /100 | #75 | Exceptional 5.7% |
| Sudanese | 99.3 /100 | #76 | Exceptional 5.7% |
| Immigrants | Vietnam | 99.3 /100 | #77 | Exceptional 5.7% |
| Somalis | 99.2 /100 | #78 | Exceptional 5.7% |
| Chileans | 99.2 /100 | #79 | Exceptional 5.7% |
| Immigrants | Ireland | 99.2 /100 | #80 | Exceptional 5.7% |
| Immigrants | Jordan | 99.2 /100 | #81 | Exceptional 5.7% |
| Palestinians | 99.2 /100 | #82 | Exceptional 5.7% |
| Eastern Europeans | 99.2 /100 | #83 | Exceptional 5.7% |
| Ugandans | 99.2 /100 | #84 | Exceptional 5.7% |
| South Americans | 99.0 /100 | #85 | Exceptional 5.7% |
Demographics Similar to Iroquois by Ambulatory Disability
In terms of ambulatory disability, the demographic groups most similar to Iroquois are Spanish American (7.1%, a difference of 0.26%), Chippewa (7.1%, a difference of 0.27%), Immigrants from the Azores (7.1%, a difference of 0.44%), Immigrants from Micronesia (7.0%, a difference of 0.53%), and Arapaho (7.1%, a difference of 0.72%).
| Demographics | Rating | Rank | Ambulatory Disability |
| Puget Sound Salish | 0.0 /100 | #299 | Tragic 6.9% |
| Marshallese | 0.0 /100 | #300 | Tragic 6.9% |
| British West Indians | 0.0 /100 | #301 | Tragic 7.0% |
| Immigrants | Armenia | 0.0 /100 | #302 | Tragic 7.0% |
| Africans | 0.0 /100 | #303 | Tragic 7.0% |
| Immigrants | Cabo Verde | 0.0 /100 | #304 | Tragic 7.0% |
| Immigrants | Micronesia | 0.0 /100 | #305 | Tragic 7.0% |
| Iroquois | 0.0 /100 | #306 | Tragic 7.1% |
| Spanish Americans | 0.0 /100 | #307 | Tragic 7.1% |
| Chippewa | 0.0 /100 | #308 | Tragic 7.1% |
| Immigrants | Azores | 0.0 /100 | #309 | Tragic 7.1% |
| Arapaho | 0.0 /100 | #310 | Tragic 7.1% |
| Cree | 0.0 /100 | #311 | Tragic 7.1% |
| Delaware | 0.0 /100 | #312 | Tragic 7.1% |
| Immigrants | Yemen | 0.0 /100 | #313 | Tragic 7.1% |