Somali vs Austrian Ambulatory Disability
COMPARE
Somali
Austrian
Ambulatory Disability
Ambulatory Disability Comparison
Somalis
Austrians
5.7%
AMBULATORY DISABILITY
99.2/ 100
METRIC RATING
78th/ 347
METRIC RANK
6.1%
AMBULATORY DISABILITY
44.1/ 100
METRIC RATING
179th/ 347
METRIC RANK
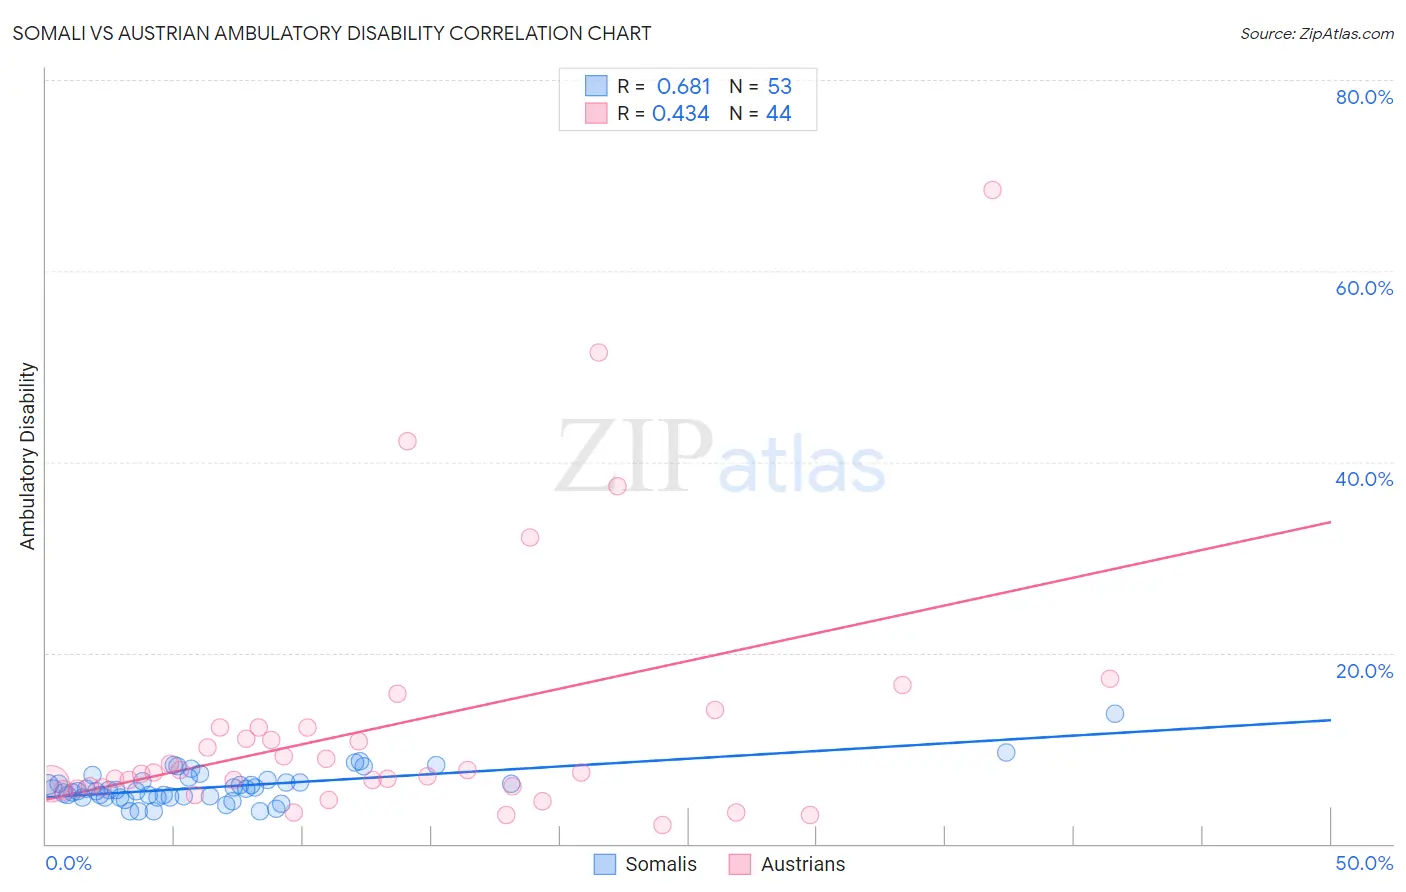
Somali vs Austrian Ambulatory Disability Correlation Chart
The statistical analysis conducted on geographies consisting of 99,294,852 people shows a significant positive correlation between the proportion of Somalis and percentage of population with ambulatory disability in the United States with a correlation coefficient (R) of 0.681 and weighted average of 5.7%. Similarly, the statistical analysis conducted on geographies consisting of 451,962,555 people shows a moderate positive correlation between the proportion of Austrians and percentage of population with ambulatory disability in the United States with a correlation coefficient (R) of 0.434 and weighted average of 6.1%, a difference of 7.2%.
Ambulatory Disability Correlation Summary
| Measurement | Somali | Austrian |
| Minimum | 3.3% | 2.0% |
| Maximum | 13.6% | 68.4% |
| Range | 10.2% | 66.4% |
| Mean | 6.0% | 12.4% |
| Median | 5.7% | 7.5% |
| Interquartile 25% (IQ1) | 4.9% | 6.0% |
| Interquartile 75% (IQ3) | 6.6% | 12.2% |
| Interquartile Range (IQR) | 1.7% | 6.2% |
| Standard Deviation (Sample) | 1.8% | 13.5% |
| Standard Deviation (Population) | 1.8% | 13.4% |
Similar Demographics by Ambulatory Disability
Demographics Similar to Somalis by Ambulatory Disability
In terms of ambulatory disability, the demographic groups most similar to Somalis are Immigrants from Vietnam (5.7%, a difference of 0.010%), Chilean (5.7%, a difference of 0.010%), Immigrants from Ireland (5.7%, a difference of 0.14%), Immigrants from Jordan (5.7%, a difference of 0.14%), and Palestinian (5.7%, a difference of 0.15%).
| Demographics | Rating | Rank | Ambulatory Disability |
| Immigrants | Peru | 99.4 /100 | #71 | Exceptional 5.7% |
| Brazilians | 99.4 /100 | #72 | Exceptional 5.7% |
| Immigrants | Northern Africa | 99.4 /100 | #73 | Exceptional 5.7% |
| Immigrants | Cameroon | 99.4 /100 | #74 | Exceptional 5.7% |
| Immigrants | South Africa | 99.3 /100 | #75 | Exceptional 5.7% |
| Sudanese | 99.3 /100 | #76 | Exceptional 5.7% |
| Immigrants | Vietnam | 99.3 /100 | #77 | Exceptional 5.7% |
| Somalis | 99.2 /100 | #78 | Exceptional 5.7% |
| Chileans | 99.2 /100 | #79 | Exceptional 5.7% |
| Immigrants | Ireland | 99.2 /100 | #80 | Exceptional 5.7% |
| Immigrants | Jordan | 99.2 /100 | #81 | Exceptional 5.7% |
| Palestinians | 99.2 /100 | #82 | Exceptional 5.7% |
| Eastern Europeans | 99.2 /100 | #83 | Exceptional 5.7% |
| Ugandans | 99.2 /100 | #84 | Exceptional 5.7% |
| South Americans | 99.0 /100 | #85 | Exceptional 5.7% |
Demographics Similar to Austrians by Ambulatory Disability
In terms of ambulatory disability, the demographic groups most similar to Austrians are Immigrants from Nicaragua (6.1%, a difference of 0.010%), Scandinavian (6.1%, a difference of 0.020%), Swiss (6.1%, a difference of 0.050%), Immigrants from England (6.1%, a difference of 0.070%), and Serbian (6.1%, a difference of 0.070%).
| Demographics | Rating | Rank | Ambulatory Disability |
| Immigrants | Burma/Myanmar | 52.2 /100 | #172 | Average 6.1% |
| Croatians | 51.2 /100 | #173 | Average 6.1% |
| Immigrants | Canada | 50.0 /100 | #174 | Average 6.1% |
| Vietnamese | 47.2 /100 | #175 | Average 6.1% |
| Immigrants | North America | 45.6 /100 | #176 | Average 6.1% |
| Immigrants | England | 45.4 /100 | #177 | Average 6.1% |
| Scandinavians | 44.5 /100 | #178 | Average 6.1% |
| Austrians | 44.1 /100 | #179 | Average 6.1% |
| Immigrants | Nicaragua | 43.9 /100 | #180 | Average 6.1% |
| Swiss | 43.1 /100 | #181 | Average 6.1% |
| Serbians | 42.8 /100 | #182 | Average 6.1% |
| Immigrants | Thailand | 42.2 /100 | #183 | Average 6.1% |
| Immigrants | Ghana | 41.2 /100 | #184 | Average 6.1% |
| Immigrants | Bosnia and Herzegovina | 37.2 /100 | #185 | Fair 6.2% |
| Europeans | 36.2 /100 | #186 | Fair 6.2% |