Immigrants from Dominica vs Lumbee Ambulatory Disability
COMPARE
Immigrants from Dominica
Lumbee
Ambulatory Disability
Ambulatory Disability Comparison
Immigrants from Dominica
Lumbee
6.9%
AMBULATORY DISABILITY
0.0/ 100
METRIC RATING
289th/ 347
METRIC RANK
9.5%
AMBULATORY DISABILITY
0.0/ 100
METRIC RATING
347th/ 347
METRIC RANK
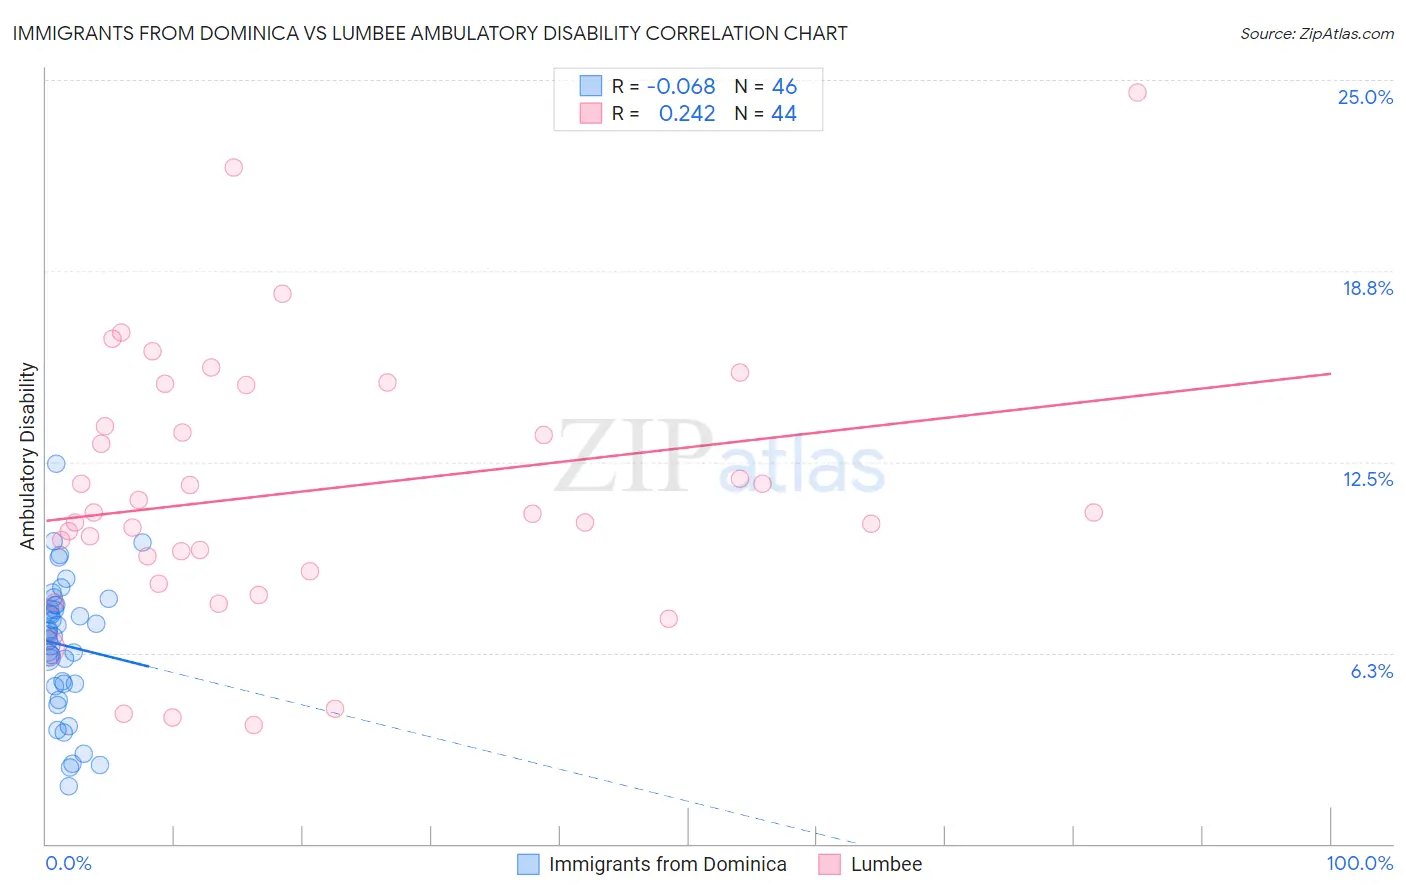
Immigrants from Dominica vs Lumbee Ambulatory Disability Correlation Chart
The statistical analysis conducted on geographies consisting of 83,791,064 people shows a slight negative correlation between the proportion of Immigrants from Dominica and percentage of population with ambulatory disability in the United States with a correlation coefficient (R) of -0.068 and weighted average of 6.9%. Similarly, the statistical analysis conducted on geographies consisting of 92,273,744 people shows a weak positive correlation between the proportion of Lumbee and percentage of population with ambulatory disability in the United States with a correlation coefficient (R) of 0.242 and weighted average of 9.5%, a difference of 39.0%.
Ambulatory Disability Correlation Summary
| Measurement | Immigrants from Dominica | Lumbee |
| Minimum | 1.9% | 3.9% |
| Maximum | 12.5% | 24.6% |
| Range | 10.6% | 20.7% |
| Mean | 6.5% | 11.5% |
| Median | 6.8% | 10.8% |
| Interquartile 25% (IQ1) | 5.2% | 9.2% |
| Interquartile 75% (IQ3) | 7.8% | 14.3% |
| Interquartile Range (IQR) | 2.6% | 5.2% |
| Standard Deviation (Sample) | 2.2% | 4.4% |
| Standard Deviation (Population) | 2.2% | 4.3% |
Similar Demographics by Ambulatory Disability
Demographics Similar to Immigrants from Dominica by Ambulatory Disability
In terms of ambulatory disability, the demographic groups most similar to Immigrants from Dominica are Scotch-Irish (6.9%, a difference of 0.030%), West Indian (6.9%, a difference of 0.12%), Nonimmigrants (6.9%, a difference of 0.14%), Cheyenne (6.9%, a difference of 0.19%), and U.S. Virgin Islander (6.8%, a difference of 0.41%).
| Demographics | Rating | Rank | Ambulatory Disability |
| Barbadians | 0.0 /100 | #282 | Tragic 6.8% |
| Immigrants | Barbados | 0.0 /100 | #283 | Tragic 6.8% |
| Immigrants | Jamaica | 0.0 /100 | #284 | Tragic 6.8% |
| Fijians | 0.0 /100 | #285 | Tragic 6.8% |
| Yakama | 0.0 /100 | #286 | Tragic 6.8% |
| U.S. Virgin Islanders | 0.0 /100 | #287 | Tragic 6.8% |
| Immigrants | Nonimmigrants | 0.0 /100 | #288 | Tragic 6.9% |
| Immigrants | Dominica | 0.0 /100 | #289 | Tragic 6.9% |
| Scotch-Irish | 0.0 /100 | #290 | Tragic 6.9% |
| West Indians | 0.0 /100 | #291 | Tragic 6.9% |
| Cheyenne | 0.0 /100 | #292 | Tragic 6.9% |
| Immigrants | St. Vincent and the Grenadines | 0.0 /100 | #293 | Tragic 6.9% |
| Cape Verdeans | 0.0 /100 | #294 | Tragic 6.9% |
| Crow | 0.0 /100 | #295 | Tragic 6.9% |
| Alaskan Athabascans | 0.0 /100 | #296 | Tragic 6.9% |
Demographics Similar to Lumbee by Ambulatory Disability
In terms of ambulatory disability, the demographic groups most similar to Lumbee are Houma (9.3%, a difference of 2.5%), Puerto Rican (8.9%, a difference of 7.5%), Tsimshian (8.8%, a difference of 8.2%), Tohono O'odham (8.7%, a difference of 9.2%), and Kiowa (8.6%, a difference of 10.8%).
| Demographics | Rating | Rank | Ambulatory Disability |
| Cherokee | 0.0 /100 | #333 | Tragic 7.9% |
| Yuman | 0.0 /100 | #334 | Tragic 7.9% |
| Chickasaw | 0.0 /100 | #335 | Tragic 8.0% |
| Seminole | 0.0 /100 | #336 | Tragic 8.0% |
| Dutch West Indians | 0.0 /100 | #337 | Tragic 8.2% |
| Colville | 0.0 /100 | #338 | Tragic 8.2% |
| Pima | 0.0 /100 | #339 | Tragic 8.2% |
| Choctaw | 0.0 /100 | #340 | Tragic 8.3% |
| Creek | 0.0 /100 | #341 | Tragic 8.5% |
| Kiowa | 0.0 /100 | #342 | Tragic 8.6% |
| Tohono O'odham | 0.0 /100 | #343 | Tragic 8.7% |
| Tsimshian | 0.0 /100 | #344 | Tragic 8.8% |
| Puerto Ricans | 0.0 /100 | #345 | Tragic 8.9% |
| Houma | 0.0 /100 | #346 | Tragic 9.3% |
| Lumbee | 0.0 /100 | #347 | Tragic 9.5% |