Somali vs Slavic Female Disability
COMPARE
Somali
Slavic
Female Disability
Female Disability Comparison
Somalis
Slavs
12.3%
FEMALE DISABILITY
21.5/ 100
METRIC RATING
202nd/ 347
METRIC RANK
12.6%
FEMALE DISABILITY
3.8/ 100
METRIC RATING
237th/ 347
METRIC RANK
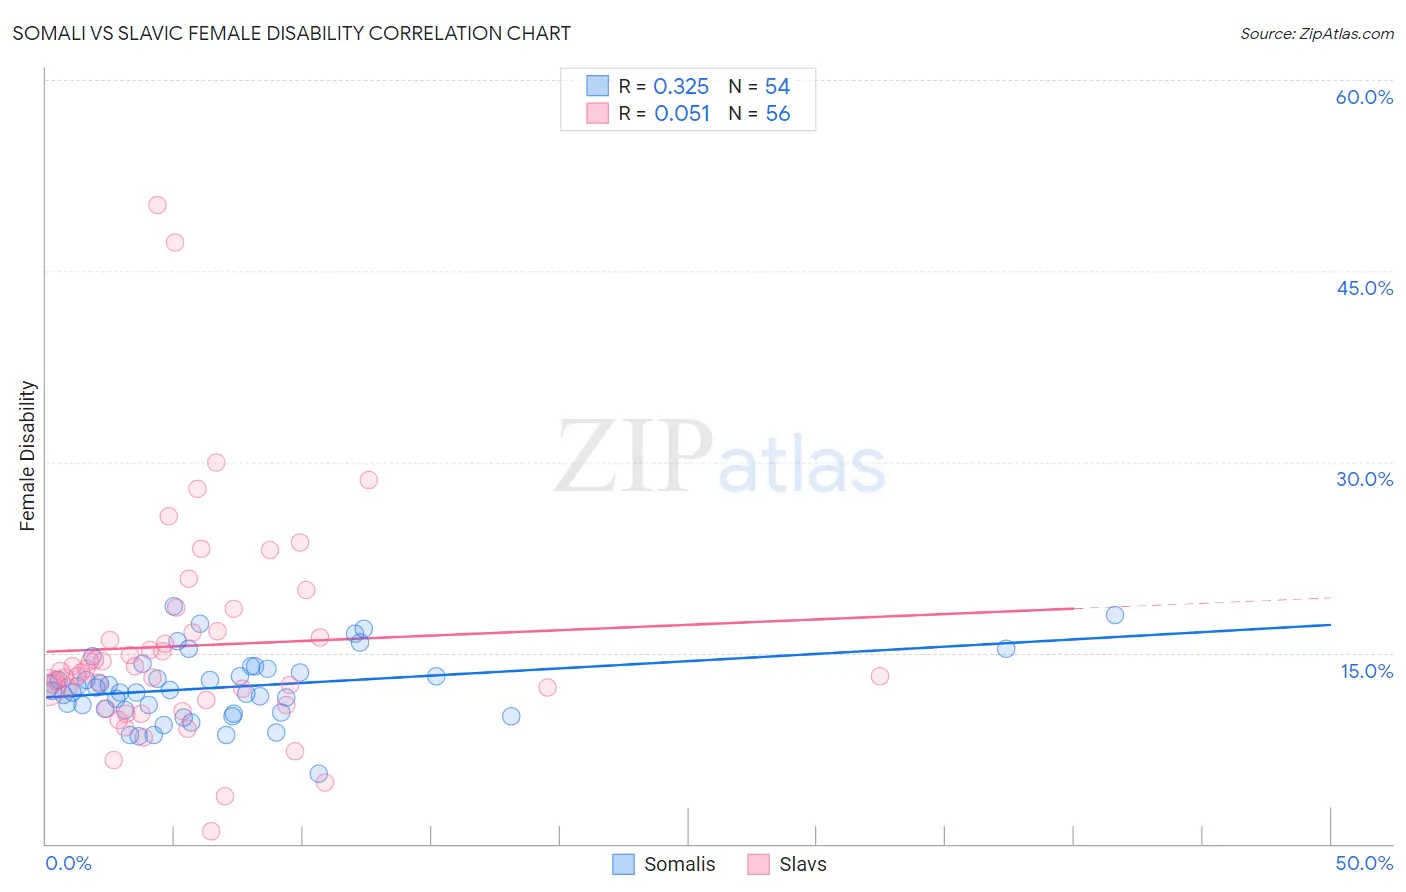
Somali vs Slavic Female Disability Correlation Chart
The statistical analysis conducted on geographies consisting of 99,314,959 people shows a mild positive correlation between the proportion of Somalis and percentage of females with a disability in the United States with a correlation coefficient (R) of 0.325 and weighted average of 12.3%. Similarly, the statistical analysis conducted on geographies consisting of 270,849,330 people shows a slight positive correlation between the proportion of Slavs and percentage of females with a disability in the United States with a correlation coefficient (R) of 0.051 and weighted average of 12.6%, a difference of 1.8%.
Female Disability Correlation Summary
| Measurement | Somali | Slavic |
| Minimum | 5.5% | 1.0% |
| Maximum | 18.6% | 50.2% |
| Range | 13.1% | 49.2% |
| Mean | 12.3% | 15.5% |
| Median | 12.1% | 13.5% |
| Interquartile 25% (IQ1) | 10.5% | 11.1% |
| Interquartile 75% (IQ3) | 13.7% | 16.6% |
| Interquartile Range (IQR) | 3.3% | 5.6% |
| Standard Deviation (Sample) | 2.7% | 8.7% |
| Standard Deviation (Population) | 2.6% | 8.6% |
Similar Demographics by Female Disability
Demographics Similar to Somalis by Female Disability
In terms of female disability, the demographic groups most similar to Somalis are Immigrants from Barbados (12.3%, a difference of 0.020%), Chinese (12.3%, a difference of 0.030%), Trinidadian and Tobagonian (12.3%, a difference of 0.040%), Immigrants from Zaire (12.3%, a difference of 0.040%), and Immigrants from Grenada (12.4%, a difference of 0.060%).
| Demographics | Rating | Rank | Female Disability |
| Swedes | 26.6 /100 | #195 | Fair 12.3% |
| Immigrants | Panama | 25.5 /100 | #196 | Fair 12.3% |
| Hondurans | 25.4 /100 | #197 | Fair 12.3% |
| Mexican American Indians | 24.9 /100 | #198 | Fair 12.3% |
| Immigrants | Trinidad and Tobago | 24.7 /100 | #199 | Fair 12.3% |
| Trinidadians and Tobagonians | 22.4 /100 | #200 | Fair 12.3% |
| Chinese | 22.1 /100 | #201 | Fair 12.3% |
| Somalis | 21.5 /100 | #202 | Fair 12.3% |
| Immigrants | Barbados | 21.1 /100 | #203 | Fair 12.3% |
| Immigrants | Zaire | 20.9 /100 | #204 | Fair 12.3% |
| Immigrants | Grenada | 20.5 /100 | #205 | Fair 12.4% |
| Immigrants | Cuba | 20.2 /100 | #206 | Fair 12.4% |
| Croatians | 20.2 /100 | #207 | Fair 12.4% |
| Basques | 17.5 /100 | #208 | Poor 12.4% |
| Mexicans | 15.7 /100 | #209 | Poor 12.4% |
Demographics Similar to Slavs by Female Disability
In terms of female disability, the demographic groups most similar to Slavs are Yugoslavian (12.6%, a difference of 0.030%), Barbadian (12.6%, a difference of 0.060%), Immigrants from West Indies (12.6%, a difference of 0.13%), German Russian (12.6%, a difference of 0.15%), and Malaysian (12.5%, a difference of 0.26%).
| Demographics | Rating | Rank | Female Disability |
| Immigrants | Belize | 7.0 /100 | #230 | Tragic 12.5% |
| Belgians | 6.5 /100 | #231 | Tragic 12.5% |
| Immigrants | Somalia | 5.9 /100 | #232 | Tragic 12.5% |
| Immigrants | Iraq | 5.3 /100 | #233 | Tragic 12.5% |
| Scandinavians | 5.3 /100 | #234 | Tragic 12.5% |
| Malaysians | 5.0 /100 | #235 | Tragic 12.5% |
| Immigrants | West Indies | 4.4 /100 | #236 | Tragic 12.6% |
| Slavs | 3.8 /100 | #237 | Tragic 12.6% |
| Yugoslavians | 3.7 /100 | #238 | Tragic 12.6% |
| Barbadians | 3.6 /100 | #239 | Tragic 12.6% |
| German Russians | 3.2 /100 | #240 | Tragic 12.6% |
| Japanese | 2.7 /100 | #241 | Tragic 12.6% |
| Canadians | 2.6 /100 | #242 | Tragic 12.6% |
| Immigrants | Senegal | 2.5 /100 | #243 | Tragic 12.6% |
| Alsatians | 2.5 /100 | #244 | Tragic 12.6% |