Somali vs Immigrants from Armenia Female Disability
COMPARE
Somali
Immigrants from Armenia
Female Disability
Female Disability Comparison
Somalis
Immigrants from Armenia
12.3%
FEMALE DISABILITY
21.5/ 100
METRIC RATING
202nd/ 347
METRIC RANK
12.7%
FEMALE DISABILITY
1.0/ 100
METRIC RATING
259th/ 347
METRIC RANK
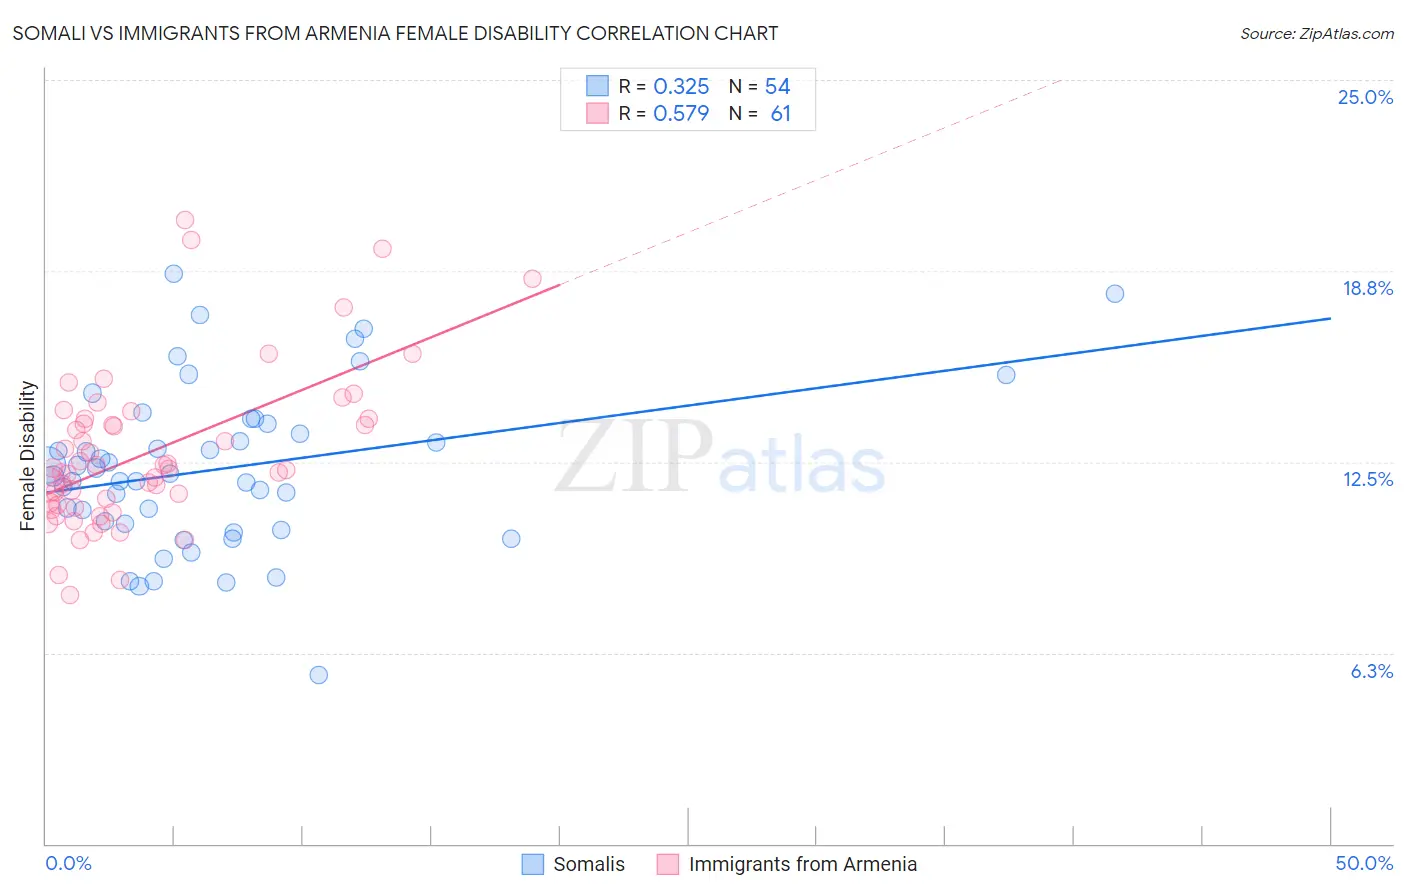
Somali vs Immigrants from Armenia Female Disability Correlation Chart
The statistical analysis conducted on geographies consisting of 99,314,959 people shows a mild positive correlation between the proportion of Somalis and percentage of females with a disability in the United States with a correlation coefficient (R) of 0.325 and weighted average of 12.3%. Similarly, the statistical analysis conducted on geographies consisting of 97,707,143 people shows a substantial positive correlation between the proportion of Immigrants from Armenia and percentage of females with a disability in the United States with a correlation coefficient (R) of 0.579 and weighted average of 12.7%, a difference of 3.0%.
Female Disability Correlation Summary
| Measurement | Somali | Immigrants from Armenia |
| Minimum | 5.5% | 8.2% |
| Maximum | 18.6% | 20.4% |
| Range | 13.1% | 12.2% |
| Mean | 12.3% | 12.8% |
| Median | 12.1% | 12.3% |
| Interquartile 25% (IQ1) | 10.5% | 11.0% |
| Interquartile 75% (IQ3) | 13.7% | 13.9% |
| Interquartile Range (IQR) | 3.3% | 2.9% |
| Standard Deviation (Sample) | 2.7% | 2.6% |
| Standard Deviation (Population) | 2.6% | 2.6% |
Similar Demographics by Female Disability
Demographics Similar to Somalis by Female Disability
In terms of female disability, the demographic groups most similar to Somalis are Immigrants from Barbados (12.3%, a difference of 0.020%), Chinese (12.3%, a difference of 0.030%), Trinidadian and Tobagonian (12.3%, a difference of 0.040%), Immigrants from Zaire (12.3%, a difference of 0.040%), and Immigrants from Grenada (12.4%, a difference of 0.060%).
| Demographics | Rating | Rank | Female Disability |
| Swedes | 26.6 /100 | #195 | Fair 12.3% |
| Immigrants | Panama | 25.5 /100 | #196 | Fair 12.3% |
| Hondurans | 25.4 /100 | #197 | Fair 12.3% |
| Mexican American Indians | 24.9 /100 | #198 | Fair 12.3% |
| Immigrants | Trinidad and Tobago | 24.7 /100 | #199 | Fair 12.3% |
| Trinidadians and Tobagonians | 22.4 /100 | #200 | Fair 12.3% |
| Chinese | 22.1 /100 | #201 | Fair 12.3% |
| Somalis | 21.5 /100 | #202 | Fair 12.3% |
| Immigrants | Barbados | 21.1 /100 | #203 | Fair 12.3% |
| Immigrants | Zaire | 20.9 /100 | #204 | Fair 12.3% |
| Immigrants | Grenada | 20.5 /100 | #205 | Fair 12.4% |
| Immigrants | Cuba | 20.2 /100 | #206 | Fair 12.4% |
| Croatians | 20.2 /100 | #207 | Fair 12.4% |
| Basques | 17.5 /100 | #208 | Poor 12.4% |
| Mexicans | 15.7 /100 | #209 | Poor 12.4% |
Demographics Similar to Immigrants from Armenia by Female Disability
In terms of female disability, the demographic groups most similar to Immigrants from Armenia are Subsaharan African (12.7%, a difference of 0.010%), Bermudan (12.7%, a difference of 0.050%), Liberian (12.7%, a difference of 0.080%), Aleut (12.7%, a difference of 0.080%), and British West Indian (12.7%, a difference of 0.11%).
| Demographics | Rating | Rank | Female Disability |
| Immigrants | Caribbean | 1.4 /100 | #252 | Tragic 12.7% |
| Jamaicans | 1.4 /100 | #253 | Tragic 12.7% |
| Hawaiians | 1.4 /100 | #254 | Tragic 12.7% |
| Immigrants | Germany | 1.3 /100 | #255 | Tragic 12.7% |
| British West Indians | 1.2 /100 | #256 | Tragic 12.7% |
| Liberians | 1.1 /100 | #257 | Tragic 12.7% |
| Aleuts | 1.1 /100 | #258 | Tragic 12.7% |
| Immigrants | Armenia | 1.0 /100 | #259 | Tragic 12.7% |
| Sub-Saharan Africans | 1.0 /100 | #260 | Tragic 12.7% |
| Bermudans | 1.0 /100 | #261 | Tragic 12.7% |
| Czechoslovakians | 0.9 /100 | #262 | Tragic 12.7% |
| Spaniards | 0.7 /100 | #263 | Tragic 12.8% |
| Alaska Natives | 0.6 /100 | #264 | Tragic 12.8% |
| West Indians | 0.5 /100 | #265 | Tragic 12.8% |
| Finns | 0.4 /100 | #266 | Tragic 12.8% |