Danish vs Immigrants from Armenia Female Disability
COMPARE
Danish
Immigrants from Armenia
Female Disability
Female Disability Comparison
Danes
Immigrants from Armenia
12.1%
FEMALE DISABILITY
72.5/ 100
METRIC RATING
157th/ 347
METRIC RANK
12.7%
FEMALE DISABILITY
1.0/ 100
METRIC RATING
259th/ 347
METRIC RANK
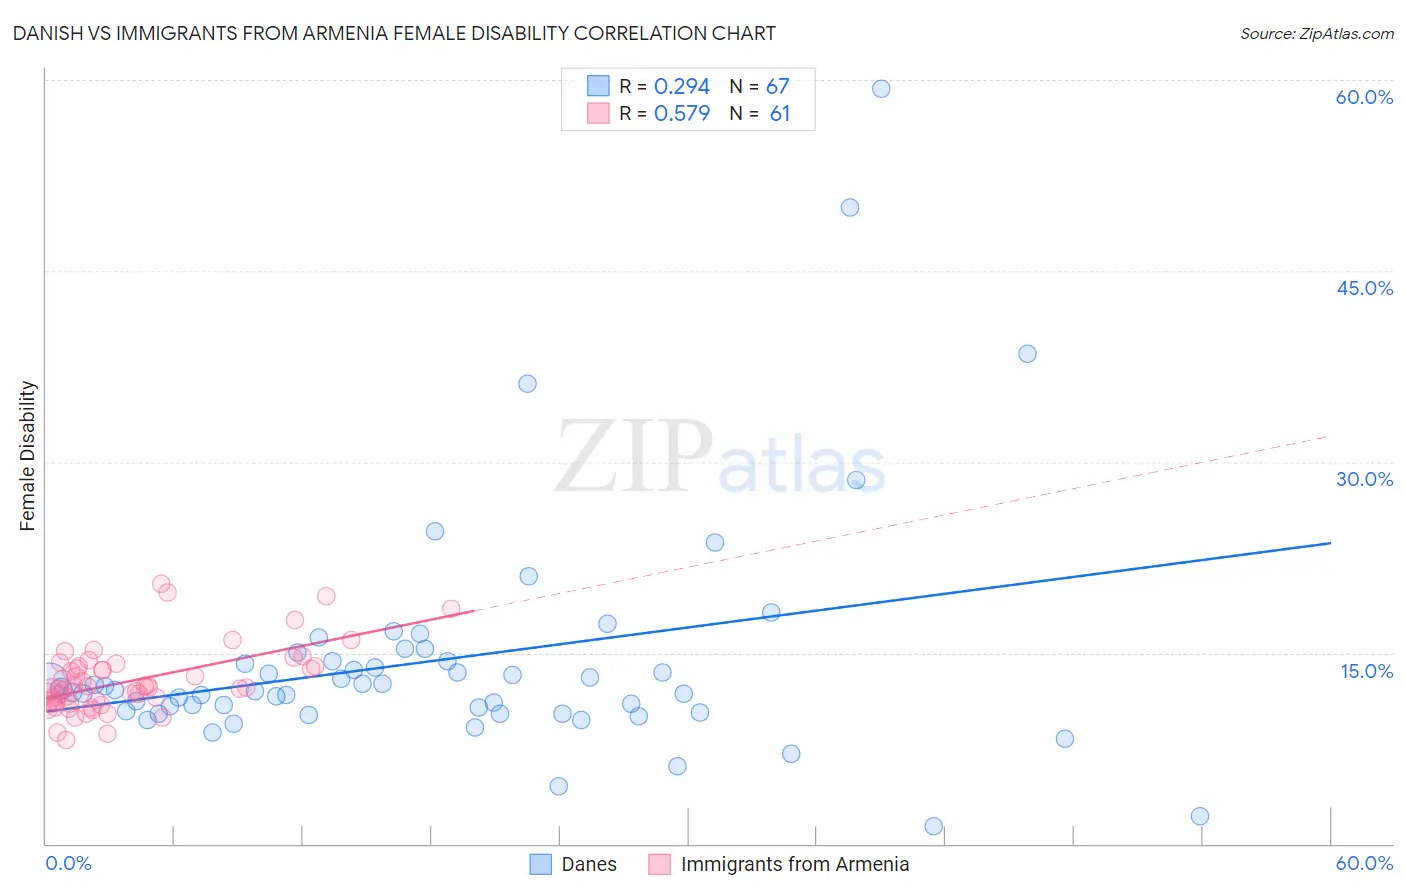
Danish vs Immigrants from Armenia Female Disability Correlation Chart
The statistical analysis conducted on geographies consisting of 474,084,483 people shows a weak positive correlation between the proportion of Danes and percentage of females with a disability in the United States with a correlation coefficient (R) of 0.294 and weighted average of 12.1%. Similarly, the statistical analysis conducted on geographies consisting of 97,707,143 people shows a substantial positive correlation between the proportion of Immigrants from Armenia and percentage of females with a disability in the United States with a correlation coefficient (R) of 0.579 and weighted average of 12.7%, a difference of 5.3%.
Female Disability Correlation Summary
| Measurement | Danish | Immigrants from Armenia |
| Minimum | 1.4% | 8.2% |
| Maximum | 59.3% | 20.4% |
| Range | 58.0% | 12.2% |
| Mean | 14.4% | 12.8% |
| Median | 12.1% | 12.3% |
| Interquartile 25% (IQ1) | 10.3% | 11.0% |
| Interquartile 75% (IQ3) | 14.3% | 13.9% |
| Interquartile Range (IQR) | 4.0% | 2.9% |
| Standard Deviation (Sample) | 9.4% | 2.6% |
| Standard Deviation (Population) | 9.3% | 2.6% |
Similar Demographics by Female Disability
Demographics Similar to Danes by Female Disability
In terms of female disability, the demographic groups most similar to Danes are Immigrants from Middle Africa (12.1%, a difference of 0.010%), Moroccan (12.1%, a difference of 0.020%), Ghanaian (12.1%, a difference of 0.20%), Syrian (12.1%, a difference of 0.22%), and Immigrants from Central America (12.1%, a difference of 0.22%).
| Demographics | Rating | Rank | Female Disability |
| Immigrants | Moldova | 81.4 /100 | #150 | Excellent 12.0% |
| Icelanders | 80.7 /100 | #151 | Excellent 12.0% |
| Immigrants | Scotland | 79.3 /100 | #152 | Good 12.0% |
| Sudanese | 79.1 /100 | #153 | Good 12.0% |
| Syrians | 76.9 /100 | #154 | Good 12.1% |
| Ghanaians | 76.6 /100 | #155 | Good 12.1% |
| Moroccans | 72.9 /100 | #156 | Good 12.1% |
| Danes | 72.5 /100 | #157 | Good 12.1% |
| Immigrants | Middle Africa | 72.4 /100 | #158 | Good 12.1% |
| Immigrants | Central America | 67.7 /100 | #159 | Good 12.1% |
| Immigrants | Guatemala | 66.0 /100 | #160 | Good 12.1% |
| Guyanese | 64.7 /100 | #161 | Good 12.1% |
| Immigrants | Ukraine | 64.3 /100 | #162 | Good 12.1% |
| Guatemalans | 63.8 /100 | #163 | Good 12.1% |
| Czechs | 63.6 /100 | #164 | Good 12.1% |
Demographics Similar to Immigrants from Armenia by Female Disability
In terms of female disability, the demographic groups most similar to Immigrants from Armenia are Subsaharan African (12.7%, a difference of 0.010%), Bermudan (12.7%, a difference of 0.050%), Liberian (12.7%, a difference of 0.080%), Aleut (12.7%, a difference of 0.080%), and British West Indian (12.7%, a difference of 0.11%).
| Demographics | Rating | Rank | Female Disability |
| Immigrants | Caribbean | 1.4 /100 | #252 | Tragic 12.7% |
| Jamaicans | 1.4 /100 | #253 | Tragic 12.7% |
| Hawaiians | 1.4 /100 | #254 | Tragic 12.7% |
| Immigrants | Germany | 1.3 /100 | #255 | Tragic 12.7% |
| British West Indians | 1.2 /100 | #256 | Tragic 12.7% |
| Liberians | 1.1 /100 | #257 | Tragic 12.7% |
| Aleuts | 1.1 /100 | #258 | Tragic 12.7% |
| Immigrants | Armenia | 1.0 /100 | #259 | Tragic 12.7% |
| Sub-Saharan Africans | 1.0 /100 | #260 | Tragic 12.7% |
| Bermudans | 1.0 /100 | #261 | Tragic 12.7% |
| Czechoslovakians | 0.9 /100 | #262 | Tragic 12.7% |
| Spaniards | 0.7 /100 | #263 | Tragic 12.8% |
| Alaska Natives | 0.6 /100 | #264 | Tragic 12.8% |
| West Indians | 0.5 /100 | #265 | Tragic 12.8% |
| Finns | 0.4 /100 | #266 | Tragic 12.8% |