Pueblo vs Immigrants from Ukraine Disability
COMPARE
Pueblo
Immigrants from Ukraine
Disability
Disability Comparison
Pueblo
Immigrants from Ukraine
14.4%
DISABILITY
0.0/ 100
METRIC RATING
332nd/ 347
METRIC RANK
11.5%
DISABILITY
77.6/ 100
METRIC RATING
147th/ 347
METRIC RANK
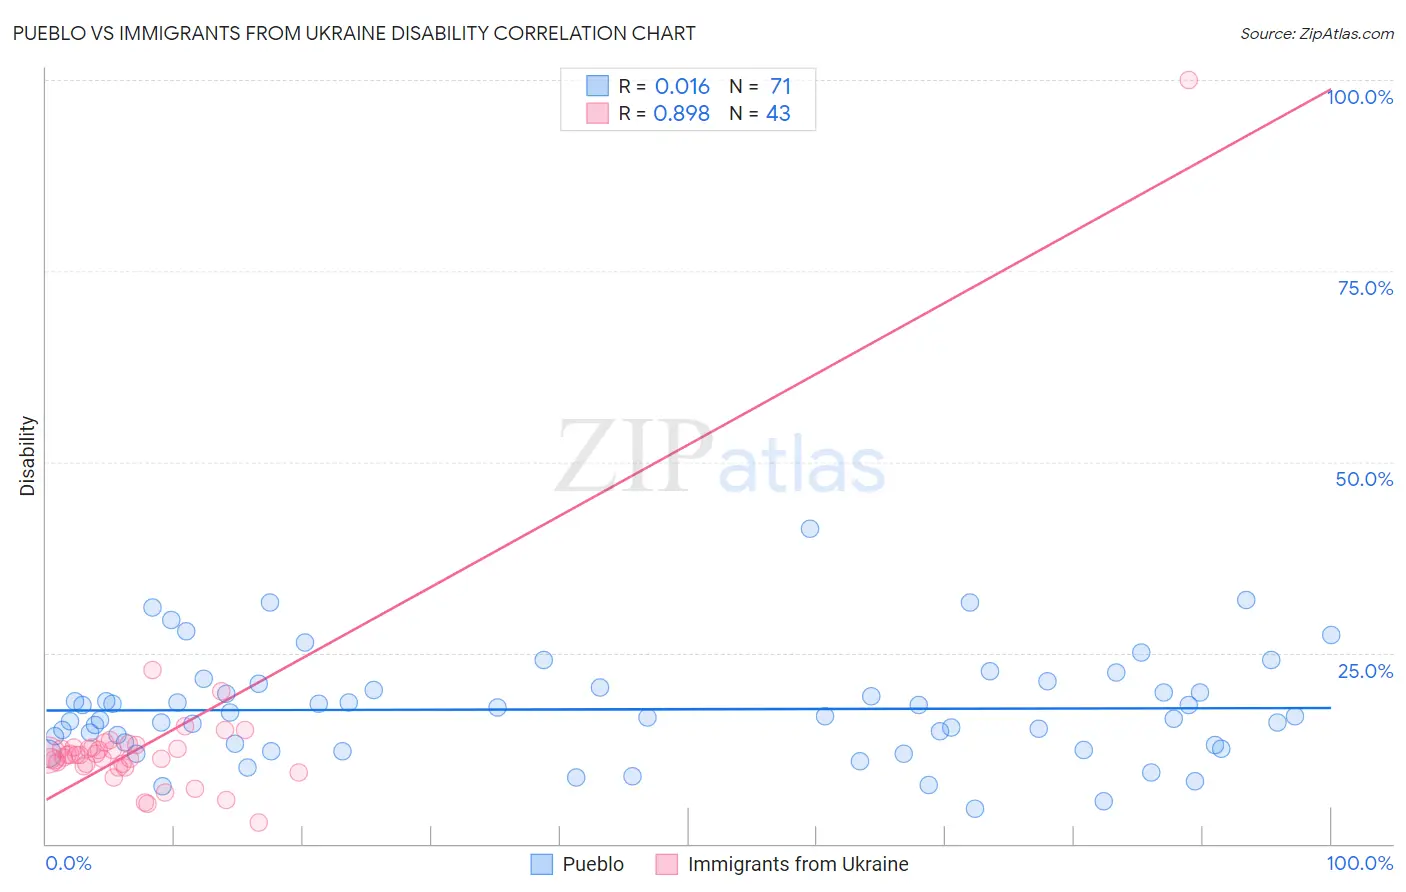
Pueblo vs Immigrants from Ukraine Disability Correlation Chart
The statistical analysis conducted on geographies consisting of 120,077,777 people shows no correlation between the proportion of Pueblo and percentage of population with a disability in the United States with a correlation coefficient (R) of 0.016 and weighted average of 14.4%. Similarly, the statistical analysis conducted on geographies consisting of 289,688,276 people shows a very strong positive correlation between the proportion of Immigrants from Ukraine and percentage of population with a disability in the United States with a correlation coefficient (R) of 0.898 and weighted average of 11.5%, a difference of 25.2%.
Disability Correlation Summary
| Measurement | Pueblo | Immigrants from Ukraine |
| Minimum | 4.5% | 2.9% |
| Maximum | 41.2% | 100.0% |
| Range | 36.7% | 97.1% |
| Mean | 17.6% | 13.4% |
| Median | 16.6% | 11.7% |
| Interquartile 25% (IQ1) | 13.0% | 10.2% |
| Interquartile 75% (IQ3) | 20.5% | 12.7% |
| Interquartile Range (IQR) | 7.5% | 2.5% |
| Standard Deviation (Sample) | 6.9% | 14.0% |
| Standard Deviation (Population) | 6.8% | 13.8% |
Similar Demographics by Disability
Demographics Similar to Pueblo by Disability
In terms of disability, the demographic groups most similar to Pueblo are Alaskan Athabascan (14.4%, a difference of 0.020%), Cajun (14.6%, a difference of 1.1%), Yuman (14.6%, a difference of 1.2%), Navajo (14.3%, a difference of 1.3%), and Potawatomi (14.2%, a difference of 1.9%).
| Demographics | Rating | Rank | Disability |
| Natives/Alaskans | 0.0 /100 | #325 | Tragic 14.2% |
| Osage | 0.0 /100 | #326 | Tragic 14.2% |
| Ottawa | 0.0 /100 | #327 | Tragic 14.2% |
| Immigrants | Azores | 0.0 /100 | #328 | Tragic 14.2% |
| Potawatomi | 0.0 /100 | #329 | Tragic 14.2% |
| Navajo | 0.0 /100 | #330 | Tragic 14.3% |
| Alaskan Athabascans | 0.0 /100 | #331 | Tragic 14.4% |
| Pueblo | 0.0 /100 | #332 | Tragic 14.4% |
| Cajuns | 0.0 /100 | #333 | Tragic 14.6% |
| Yuman | 0.0 /100 | #334 | Tragic 14.6% |
| Tohono O'odham | 0.0 /100 | #335 | Tragic 14.8% |
| Cherokee | 0.0 /100 | #336 | Tragic 14.8% |
| Seminole | 0.0 /100 | #337 | Tragic 14.9% |
| Dutch West Indians | 0.0 /100 | #338 | Tragic 14.9% |
| Chickasaw | 0.0 /100 | #339 | Tragic 15.2% |
Demographics Similar to Immigrants from Ukraine by Disability
In terms of disability, the demographic groups most similar to Immigrants from Ukraine are Sudanese (11.5%, a difference of 0.030%), Immigrants from Hungary (11.5%, a difference of 0.090%), Nigerian (11.5%, a difference of 0.26%), Immigrants from Norway (11.6%, a difference of 0.27%), and Romanian (11.6%, a difference of 0.30%).
| Demographics | Rating | Rank | Disability |
| Russians | 86.8 /100 | #140 | Excellent 11.5% |
| Immigrants | Grenada | 86.1 /100 | #141 | Excellent 11.5% |
| Immigrants | Sudan | 85.3 /100 | #142 | Excellent 11.5% |
| Moroccans | 83.3 /100 | #143 | Excellent 11.5% |
| Australians | 82.5 /100 | #144 | Excellent 11.5% |
| Nigerians | 81.3 /100 | #145 | Excellent 11.5% |
| Immigrants | Hungary | 79.0 /100 | #146 | Good 11.5% |
| Immigrants | Ukraine | 77.6 /100 | #147 | Good 11.5% |
| Sudanese | 77.1 /100 | #148 | Good 11.5% |
| Immigrants | Norway | 73.2 /100 | #149 | Good 11.6% |
| Romanians | 72.7 /100 | #150 | Good 11.6% |
| Immigrants | Kenya | 72.1 /100 | #151 | Good 11.6% |
| Immigrants | Moldova | 72.0 /100 | #152 | Good 11.6% |
| Immigrants | Ghana | 71.2 /100 | #153 | Good 11.6% |
| Immigrants | Guatemala | 71.1 /100 | #154 | Good 11.6% |