Iroquois vs Immigrants from Norway Vision Disability
COMPARE
Iroquois
Immigrants from Norway
Vision Disability
Vision Disability Comparison
Iroquois
Immigrants from Norway
2.6%
VISION DISABILITY
0.0/ 100
METRIC RATING
306th/ 347
METRIC RANK
2.1%
VISION DISABILITY
75.5/ 100
METRIC RATING
151st/ 347
METRIC RANK
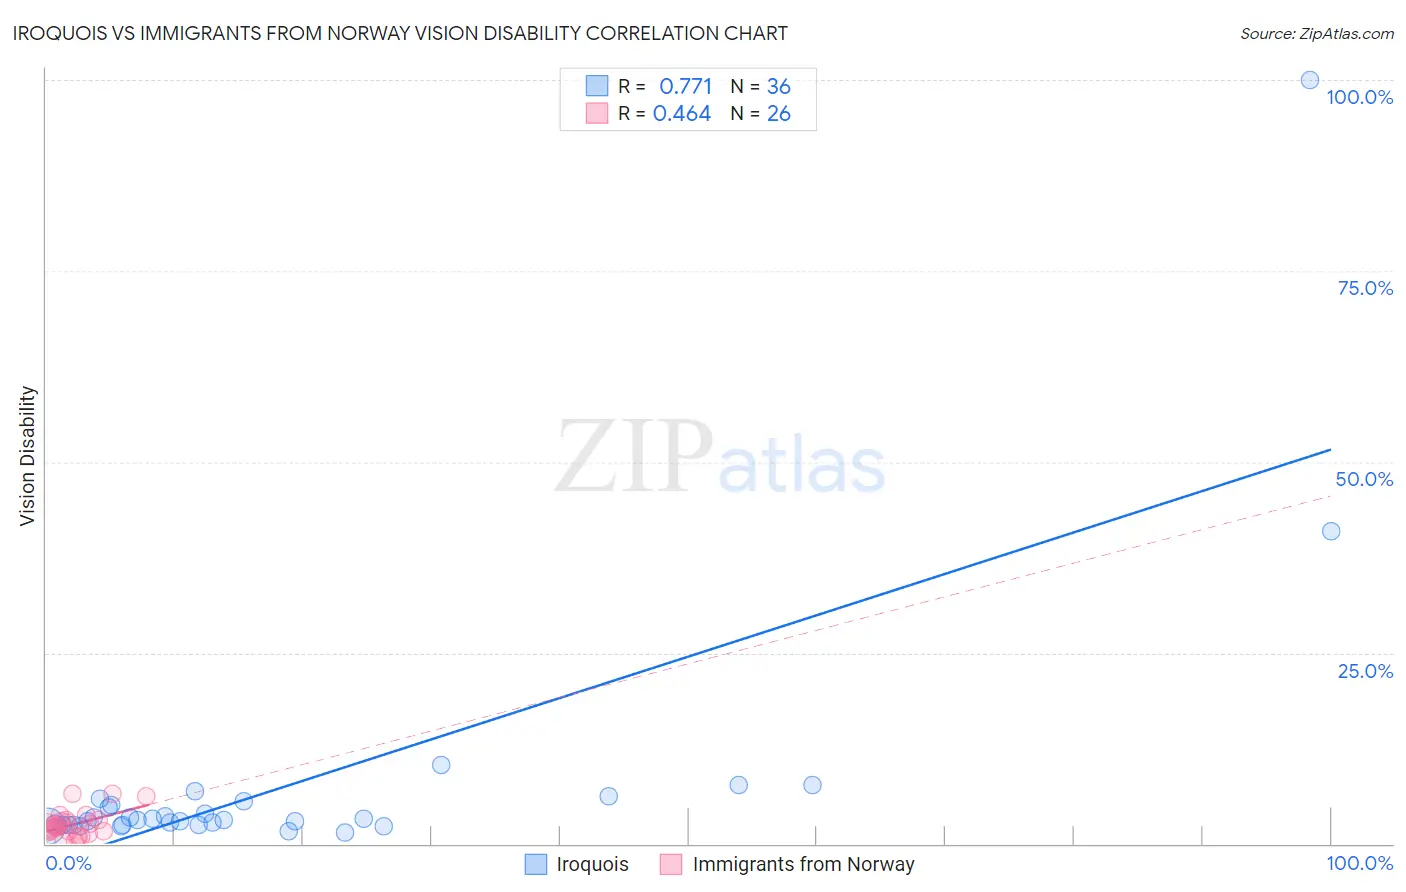
Iroquois vs Immigrants from Norway Vision Disability Correlation Chart
The statistical analysis conducted on geographies consisting of 207,187,482 people shows a strong positive correlation between the proportion of Iroquois and percentage of population with vision disability in the United States with a correlation coefficient (R) of 0.771 and weighted average of 2.6%. Similarly, the statistical analysis conducted on geographies consisting of 116,669,624 people shows a moderate positive correlation between the proportion of Immigrants from Norway and percentage of population with vision disability in the United States with a correlation coefficient (R) of 0.464 and weighted average of 2.1%, a difference of 22.6%.
Vision Disability Correlation Summary
| Measurement | Iroquois | Immigrants from Norway |
| Minimum | 1.5% | 0.30% |
| Maximum | 100.0% | 6.6% |
| Range | 98.5% | 6.3% |
| Mean | 7.5% | 2.5% |
| Median | 3.1% | 2.2% |
| Interquartile 25% (IQ1) | 2.4% | 1.6% |
| Interquartile 75% (IQ3) | 5.3% | 3.1% |
| Interquartile Range (IQR) | 2.9% | 1.4% |
| Standard Deviation (Sample) | 17.1% | 1.7% |
| Standard Deviation (Population) | 16.9% | 1.7% |
Similar Demographics by Vision Disability
Demographics Similar to Iroquois by Vision Disability
In terms of vision disability, the demographic groups most similar to Iroquois are Immigrants from Dominican Republic (2.6%, a difference of 0.020%), Arapaho (2.6%, a difference of 0.040%), Immigrants from Yemen (2.6%, a difference of 0.33%), Hispanic or Latino (2.6%, a difference of 0.61%), and Blackfeet (2.6%, a difference of 0.65%).
| Demographics | Rating | Rank | Vision Disability |
| Cree | 0.0 /100 | #299 | Tragic 2.5% |
| Africans | 0.0 /100 | #300 | Tragic 2.5% |
| Menominee | 0.0 /100 | #301 | Tragic 2.5% |
| Spanish American Indians | 0.0 /100 | #302 | Tragic 2.6% |
| Immigrants | Cabo Verde | 0.0 /100 | #303 | Tragic 2.6% |
| Aleuts | 0.0 /100 | #304 | Tragic 2.6% |
| Hispanics or Latinos | 0.0 /100 | #305 | Tragic 2.6% |
| Iroquois | 0.0 /100 | #306 | Tragic 2.6% |
| Immigrants | Dominican Republic | 0.0 /100 | #307 | Tragic 2.6% |
| Arapaho | 0.0 /100 | #308 | Tragic 2.6% |
| Immigrants | Yemen | 0.0 /100 | #309 | Tragic 2.6% |
| Blackfeet | 0.0 /100 | #310 | Tragic 2.6% |
| Dominicans | 0.0 /100 | #311 | Tragic 2.6% |
| Americans | 0.0 /100 | #312 | Tragic 2.6% |
| Potawatomi | 0.0 /100 | #313 | Tragic 2.6% |
Demographics Similar to Immigrants from Norway by Vision Disability
In terms of vision disability, the demographic groups most similar to Immigrants from Norway are Belgian (2.1%, a difference of 0.040%), Colombian (2.1%, a difference of 0.070%), Immigrants from Southern Europe (2.1%, a difference of 0.080%), Immigrants from South America (2.1%, a difference of 0.15%), and Slovene (2.1%, a difference of 0.16%).
| Demographics | Rating | Rank | Vision Disability |
| Ukrainians | 81.9 /100 | #144 | Excellent 2.1% |
| Immigrants | Bosnia and Herzegovina | 81.5 /100 | #145 | Excellent 2.1% |
| Italians | 79.7 /100 | #146 | Good 2.1% |
| Immigrants | Sudan | 78.4 /100 | #147 | Good 2.1% |
| Finns | 78.3 /100 | #148 | Good 2.1% |
| Colombians | 76.2 /100 | #149 | Good 2.1% |
| Belgians | 75.9 /100 | #150 | Good 2.1% |
| Immigrants | Norway | 75.5 /100 | #151 | Good 2.1% |
| Immigrants | Southern Europe | 74.6 /100 | #152 | Good 2.1% |
| Immigrants | South America | 73.8 /100 | #153 | Good 2.1% |
| Slovenes | 73.6 /100 | #154 | Good 2.1% |
| Immigrants | Colombia | 72.1 /100 | #155 | Good 2.1% |
| Pakistanis | 71.6 /100 | #156 | Good 2.1% |
| Serbians | 70.2 /100 | #157 | Good 2.1% |
| Immigrants | Uzbekistan | 69.9 /100 | #158 | Good 2.1% |