Malaysian vs Immigrants from Norway Vision Disability
COMPARE
Malaysian
Immigrants from Norway
Vision Disability
Vision Disability Comparison
Malaysians
Immigrants from Norway
2.3%
VISION DISABILITY
0.9/ 100
METRIC RATING
241st/ 347
METRIC RANK
2.1%
VISION DISABILITY
75.5/ 100
METRIC RATING
151st/ 347
METRIC RANK
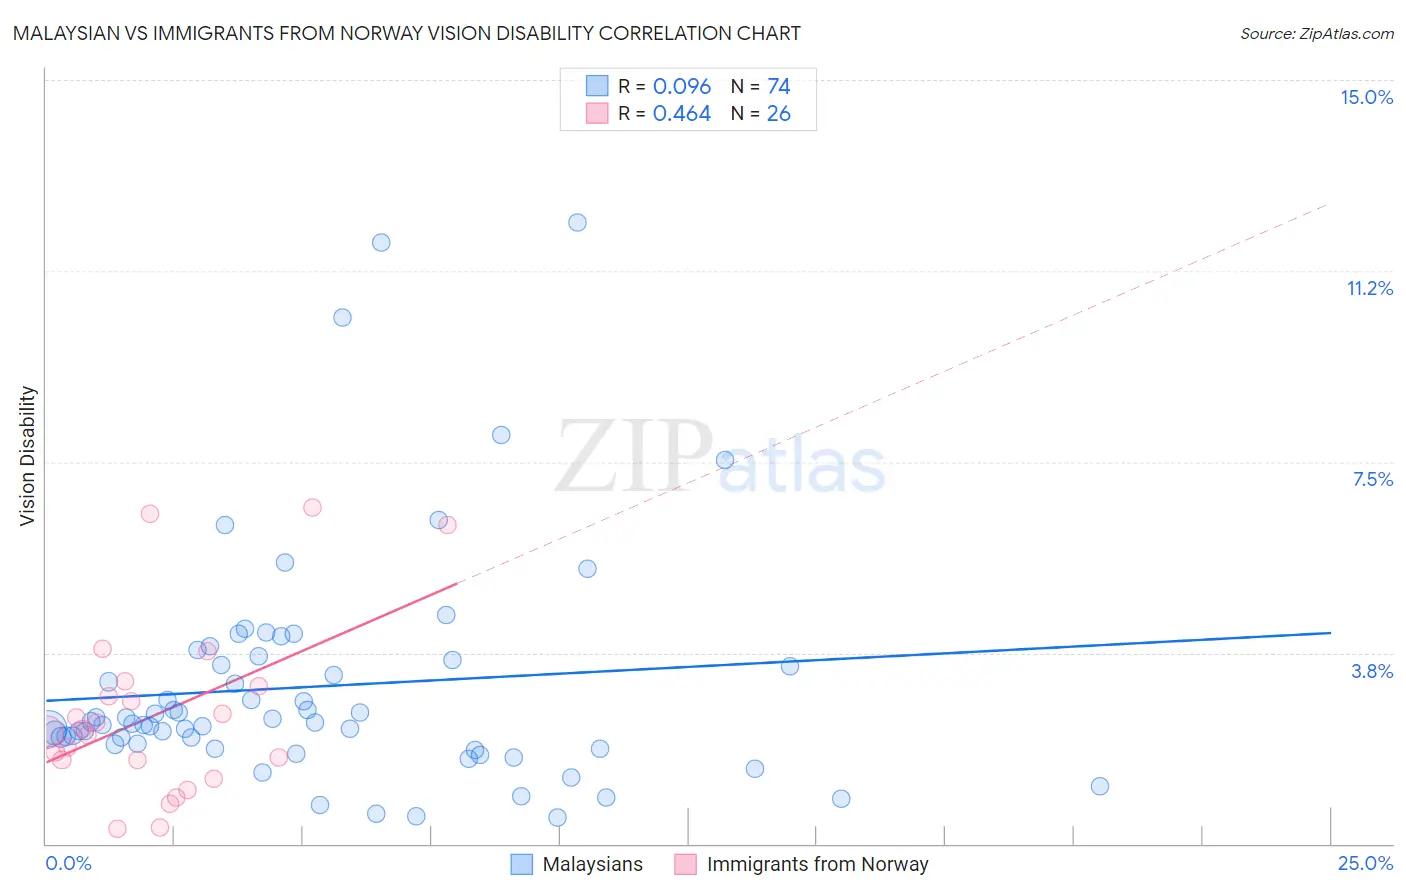
Malaysian vs Immigrants from Norway Vision Disability Correlation Chart
The statistical analysis conducted on geographies consisting of 226,017,600 people shows a slight positive correlation between the proportion of Malaysians and percentage of population with vision disability in the United States with a correlation coefficient (R) of 0.096 and weighted average of 2.3%. Similarly, the statistical analysis conducted on geographies consisting of 116,669,624 people shows a moderate positive correlation between the proportion of Immigrants from Norway and percentage of population with vision disability in the United States with a correlation coefficient (R) of 0.464 and weighted average of 2.1%, a difference of 9.3%.
Vision Disability Correlation Summary
| Measurement | Malaysian | Immigrants from Norway |
| Minimum | 0.52% | 0.30% |
| Maximum | 12.2% | 6.6% |
| Range | 11.7% | 6.3% |
| Mean | 3.1% | 2.5% |
| Median | 2.4% | 2.2% |
| Interquartile 25% (IQ1) | 2.0% | 1.6% |
| Interquartile 75% (IQ3) | 3.6% | 3.1% |
| Interquartile Range (IQR) | 1.6% | 1.4% |
| Standard Deviation (Sample) | 2.3% | 1.7% |
| Standard Deviation (Population) | 2.3% | 1.7% |
Similar Demographics by Vision Disability
Demographics Similar to Malaysians by Vision Disability
In terms of vision disability, the demographic groups most similar to Malaysians are Panamanian (2.3%, a difference of 0.030%), Immigrants from Panama (2.3%, a difference of 0.14%), English (2.3%, a difference of 0.29%), Immigrants from Cambodia (2.3%, a difference of 0.30%), and Immigrants from Portugal (2.3%, a difference of 0.57%).
| Demographics | Rating | Rank | Vision Disability |
| Scottish | 1.6 /100 | #234 | Tragic 2.3% |
| Marshallese | 1.5 /100 | #235 | Tragic 2.3% |
| Immigrants | Congo | 1.4 /100 | #236 | Tragic 2.3% |
| Immigrants | Portugal | 1.4 /100 | #237 | Tragic 2.3% |
| Immigrants | Cambodia | 1.1 /100 | #238 | Tragic 2.3% |
| English | 1.1 /100 | #239 | Tragic 2.3% |
| Panamanians | 0.9 /100 | #240 | Tragic 2.3% |
| Malaysians | 0.9 /100 | #241 | Tragic 2.3% |
| Immigrants | Panama | 0.8 /100 | #242 | Tragic 2.3% |
| Immigrants | Nicaragua | 0.6 /100 | #243 | Tragic 2.3% |
| Immigrants | West Indies | 0.6 /100 | #244 | Tragic 2.3% |
| Alsatians | 0.6 /100 | #245 | Tragic 2.3% |
| French | 0.5 /100 | #246 | Tragic 2.3% |
| Guatemalans | 0.5 /100 | #247 | Tragic 2.3% |
| Sub-Saharan Africans | 0.5 /100 | #248 | Tragic 2.3% |
Demographics Similar to Immigrants from Norway by Vision Disability
In terms of vision disability, the demographic groups most similar to Immigrants from Norway are Belgian (2.1%, a difference of 0.040%), Colombian (2.1%, a difference of 0.070%), Immigrants from Southern Europe (2.1%, a difference of 0.080%), Immigrants from South America (2.1%, a difference of 0.15%), and Slovene (2.1%, a difference of 0.16%).
| Demographics | Rating | Rank | Vision Disability |
| Ukrainians | 81.9 /100 | #144 | Excellent 2.1% |
| Immigrants | Bosnia and Herzegovina | 81.5 /100 | #145 | Excellent 2.1% |
| Italians | 79.7 /100 | #146 | Good 2.1% |
| Immigrants | Sudan | 78.4 /100 | #147 | Good 2.1% |
| Finns | 78.3 /100 | #148 | Good 2.1% |
| Colombians | 76.2 /100 | #149 | Good 2.1% |
| Belgians | 75.9 /100 | #150 | Good 2.1% |
| Immigrants | Norway | 75.5 /100 | #151 | Good 2.1% |
| Immigrants | Southern Europe | 74.6 /100 | #152 | Good 2.1% |
| Immigrants | South America | 73.8 /100 | #153 | Good 2.1% |
| Slovenes | 73.6 /100 | #154 | Good 2.1% |
| Immigrants | Colombia | 72.1 /100 | #155 | Good 2.1% |
| Pakistanis | 71.6 /100 | #156 | Good 2.1% |
| Serbians | 70.2 /100 | #157 | Good 2.1% |
| Immigrants | Uzbekistan | 69.9 /100 | #158 | Good 2.1% |