Polish vs Immigrants from Norway Vision Disability
COMPARE
Polish
Immigrants from Norway
Vision Disability
Vision Disability Comparison
Poles
Immigrants from Norway
2.1%
VISION DISABILITY
92.0/ 100
METRIC RATING
117th/ 347
METRIC RANK
2.1%
VISION DISABILITY
75.5/ 100
METRIC RATING
151st/ 347
METRIC RANK
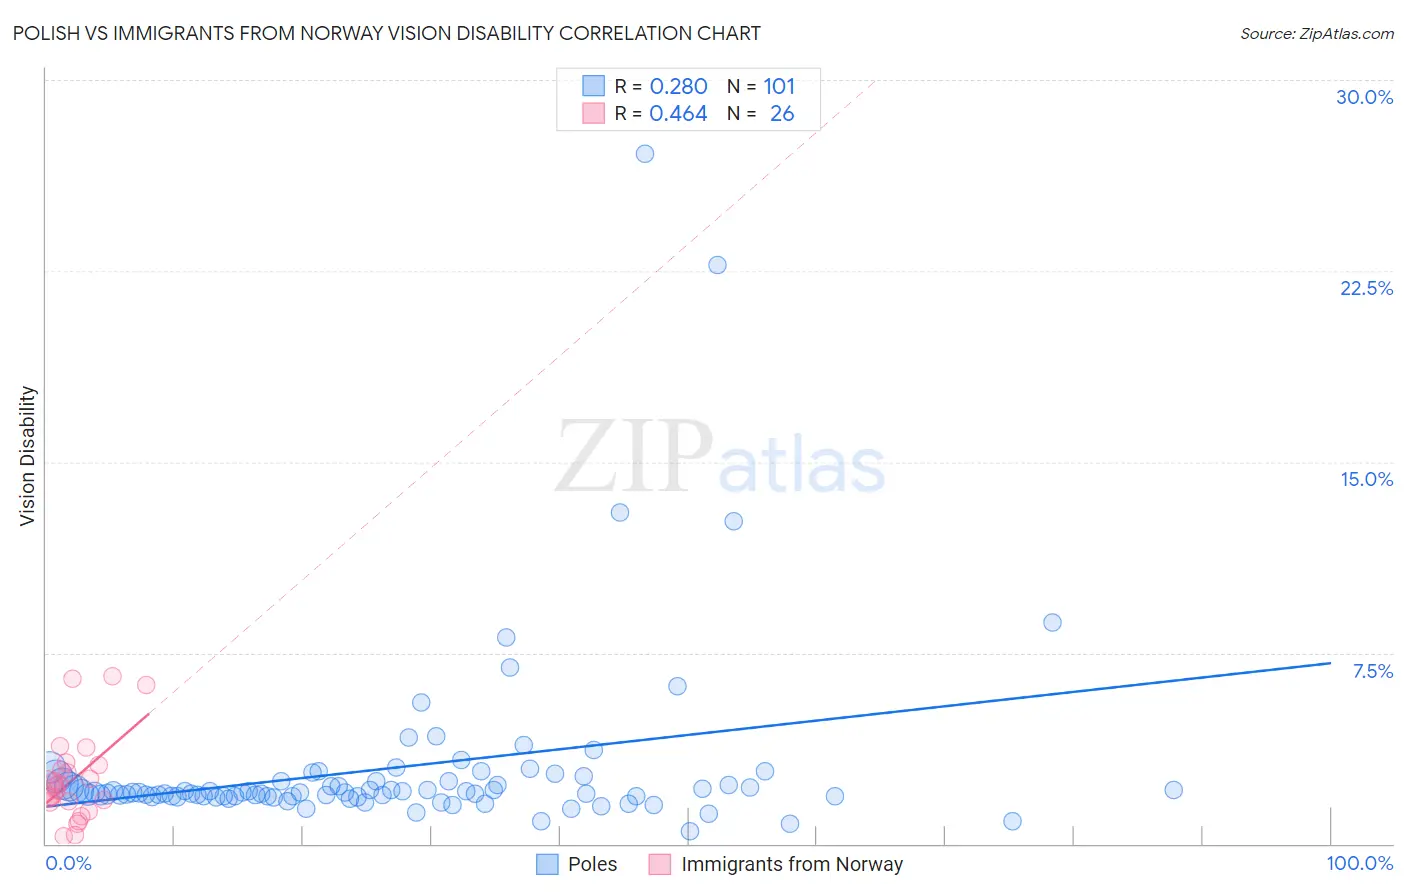
Polish vs Immigrants from Norway Vision Disability Correlation Chart
The statistical analysis conducted on geographies consisting of 558,655,799 people shows a weak positive correlation between the proportion of Poles and percentage of population with vision disability in the United States with a correlation coefficient (R) of 0.280 and weighted average of 2.1%. Similarly, the statistical analysis conducted on geographies consisting of 116,669,624 people shows a moderate positive correlation between the proportion of Immigrants from Norway and percentage of population with vision disability in the United States with a correlation coefficient (R) of 0.464 and weighted average of 2.1%, a difference of 2.1%.
Vision Disability Correlation Summary
| Measurement | Polish | Immigrants from Norway |
| Minimum | 0.47% | 0.30% |
| Maximum | 27.1% | 6.6% |
| Range | 26.7% | 6.3% |
| Mean | 3.0% | 2.5% |
| Median | 2.0% | 2.2% |
| Interquartile 25% (IQ1) | 1.9% | 1.6% |
| Interquartile 75% (IQ3) | 2.5% | 3.1% |
| Interquartile Range (IQR) | 0.60% | 1.4% |
| Standard Deviation (Sample) | 3.7% | 1.7% |
| Standard Deviation (Population) | 3.7% | 1.7% |
Similar Demographics by Vision Disability
Demographics Similar to Poles by Vision Disability
In terms of vision disability, the demographic groups most similar to Poles are Ugandan (2.1%, a difference of 0.040%), Immigrants from Vietnam (2.1%, a difference of 0.050%), Croatian (2.1%, a difference of 0.070%), Kenyan (2.1%, a difference of 0.11%), and Immigrants from Philippines (2.1%, a difference of 0.13%).
| Demographics | Rating | Rank | Vision Disability |
| Immigrants | Armenia | 93.8 /100 | #110 | Exceptional 2.1% |
| Peruvians | 93.5 /100 | #111 | Exceptional 2.1% |
| Immigrants | Denmark | 92.9 /100 | #112 | Exceptional 2.1% |
| Kenyans | 92.5 /100 | #113 | Exceptional 2.1% |
| Croatians | 92.3 /100 | #114 | Exceptional 2.1% |
| Immigrants | Vietnam | 92.2 /100 | #115 | Exceptional 2.1% |
| Ugandans | 92.2 /100 | #116 | Exceptional 2.1% |
| Poles | 92.0 /100 | #117 | Exceptional 2.1% |
| Immigrants | Philippines | 91.4 /100 | #118 | Exceptional 2.1% |
| Immigrants | Uganda | 91.4 /100 | #119 | Exceptional 2.1% |
| Immigrants | Zimbabwe | 91.0 /100 | #120 | Exceptional 2.1% |
| Immigrants | Scotland | 90.4 /100 | #121 | Exceptional 2.1% |
| Immigrants | Ukraine | 90.4 /100 | #122 | Exceptional 2.1% |
| Immigrants | Albania | 90.4 /100 | #123 | Exceptional 2.1% |
| Immigrants | Spain | 89.8 /100 | #124 | Excellent 2.1% |
Demographics Similar to Immigrants from Norway by Vision Disability
In terms of vision disability, the demographic groups most similar to Immigrants from Norway are Belgian (2.1%, a difference of 0.040%), Colombian (2.1%, a difference of 0.070%), Immigrants from Southern Europe (2.1%, a difference of 0.080%), Immigrants from South America (2.1%, a difference of 0.15%), and Slovene (2.1%, a difference of 0.16%).
| Demographics | Rating | Rank | Vision Disability |
| Ukrainians | 81.9 /100 | #144 | Excellent 2.1% |
| Immigrants | Bosnia and Herzegovina | 81.5 /100 | #145 | Excellent 2.1% |
| Italians | 79.7 /100 | #146 | Good 2.1% |
| Immigrants | Sudan | 78.4 /100 | #147 | Good 2.1% |
| Finns | 78.3 /100 | #148 | Good 2.1% |
| Colombians | 76.2 /100 | #149 | Good 2.1% |
| Belgians | 75.9 /100 | #150 | Good 2.1% |
| Immigrants | Norway | 75.5 /100 | #151 | Good 2.1% |
| Immigrants | Southern Europe | 74.6 /100 | #152 | Good 2.1% |
| Immigrants | South America | 73.8 /100 | #153 | Good 2.1% |
| Slovenes | 73.6 /100 | #154 | Good 2.1% |
| Immigrants | Colombia | 72.1 /100 | #155 | Good 2.1% |
| Pakistanis | 71.6 /100 | #156 | Good 2.1% |
| Serbians | 70.2 /100 | #157 | Good 2.1% |
| Immigrants | Uzbekistan | 69.9 /100 | #158 | Good 2.1% |