Egyptian vs Immigrants from Iran Disability Age Under 5
COMPARE
Egyptian
Immigrants from Iran
Disability Age Under 5
Disability Age Under 5 Comparison
Egyptians
Immigrants from Iran
1.1%
DISABILITY AGE UNDER 5
98.9/ 100
METRIC RATING
64th/ 347
METRIC RANK
1.00%
DISABILITY AGE UNDER 5
100.0/ 100
METRIC RATING
22nd/ 347
METRIC RANK
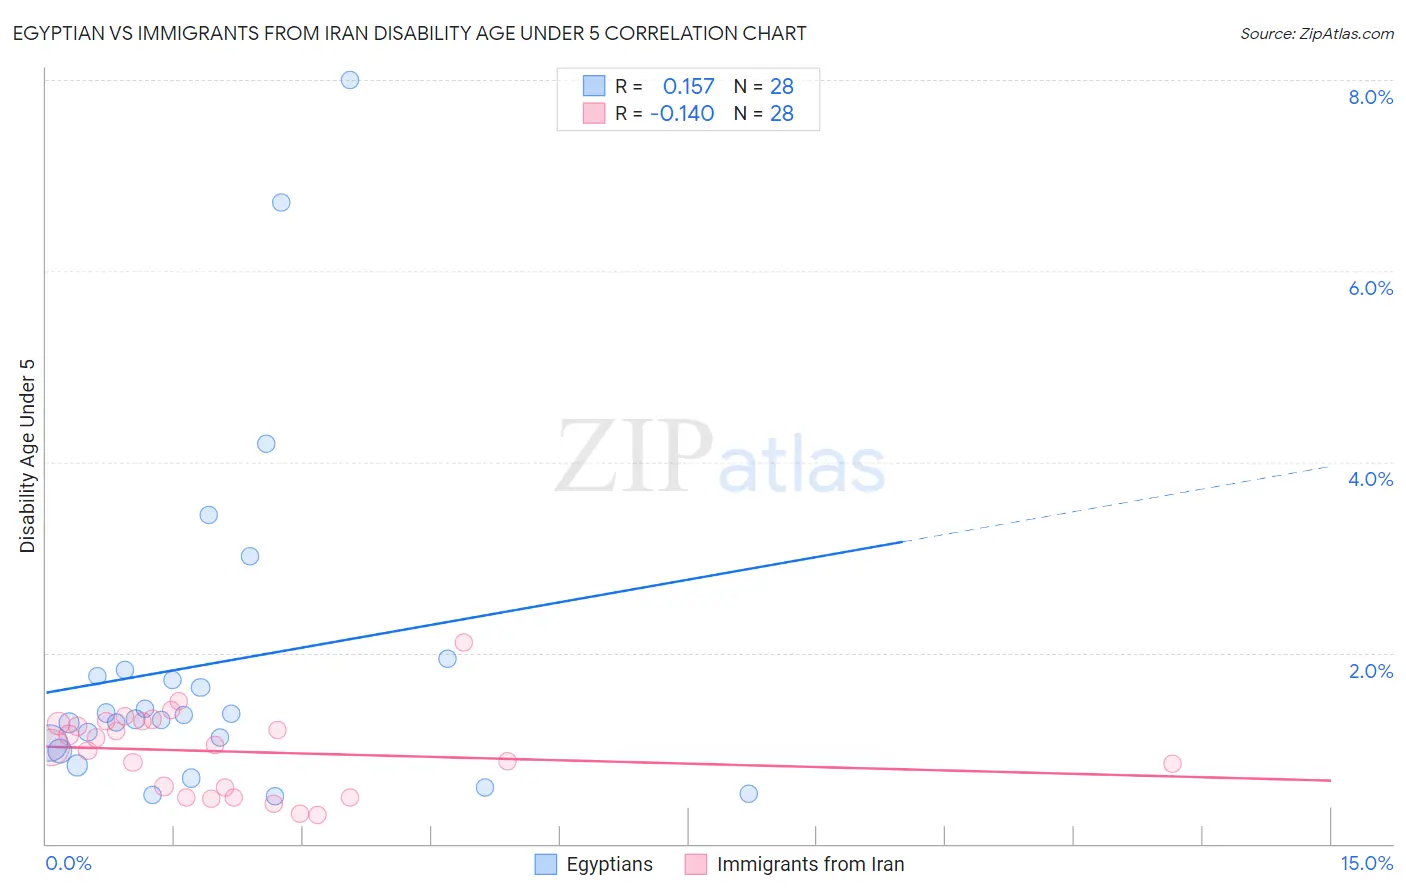
Egyptian vs Immigrants from Iran Disability Age Under 5 Correlation Chart
The statistical analysis conducted on geographies consisting of 167,621,034 people shows a poor positive correlation between the proportion of Egyptians and percentage of population with a disability under the age of 5 in the United States with a correlation coefficient (R) of 0.157 and weighted average of 1.1%. Similarly, the statistical analysis conducted on geographies consisting of 168,672,244 people shows a poor negative correlation between the proportion of Immigrants from Iran and percentage of population with a disability under the age of 5 in the United States with a correlation coefficient (R) of -0.140 and weighted average of 1.00%, a difference of 11.4%.
Disability Age Under 5 Correlation Summary
| Measurement | Egyptian | Immigrants from Iran |
| Minimum | 0.49% | 0.30% |
| Maximum | 8.0% | 2.1% |
| Range | 7.5% | 1.8% |
| Mean | 1.9% | 0.97% |
| Median | 1.3% | 1.0% |
| Interquartile 25% (IQ1) | 1.0% | 0.54% |
| Interquartile 75% (IQ3) | 1.8% | 1.3% |
| Interquartile Range (IQR) | 0.77% | 0.73% |
| Standard Deviation (Sample) | 1.8% | 0.43% |
| Standard Deviation (Population) | 1.7% | 0.42% |
Similar Demographics by Disability Age Under 5
Demographics Similar to Egyptians by Disability Age Under 5
In terms of disability age under 5, the demographic groups most similar to Egyptians are Immigrants from Korea (1.1%, a difference of 0.34%), Immigrants from Vietnam (1.1%, a difference of 0.46%), Immigrants from Indonesia (1.1%, a difference of 0.46%), Immigrants from Belize (1.1%, a difference of 0.53%), and Immigrants from Switzerland (1.1%, a difference of 0.57%).
| Demographics | Rating | Rank | Disability Age Under 5 |
| Assyrians/Chaldeans/Syriacs | 99.5 /100 | #57 | Exceptional 1.1% |
| Immigrants | Egypt | 99.4 /100 | #58 | Exceptional 1.1% |
| Immigrants | Malaysia | 99.4 /100 | #59 | Exceptional 1.1% |
| Immigrants | Western Asia | 99.2 /100 | #60 | Exceptional 1.1% |
| Immigrants | Ethiopia | 99.2 /100 | #61 | Exceptional 1.1% |
| Immigrants | Switzerland | 99.2 /100 | #62 | Exceptional 1.1% |
| Immigrants | Vietnam | 99.1 /100 | #63 | Exceptional 1.1% |
| Egyptians | 98.9 /100 | #64 | Exceptional 1.1% |
| Immigrants | Korea | 98.8 /100 | #65 | Exceptional 1.1% |
| Immigrants | Indonesia | 98.7 /100 | #66 | Exceptional 1.1% |
| Immigrants | Belize | 98.7 /100 | #67 | Exceptional 1.1% |
| South Africans | 98.7 /100 | #68 | Exceptional 1.1% |
| Israelis | 98.7 /100 | #69 | Exceptional 1.1% |
| Immigrants | Ecuador | 98.6 /100 | #70 | Exceptional 1.1% |
| Trinidadians and Tobagonians | 98.6 /100 | #71 | Exceptional 1.1% |
Demographics Similar to Immigrants from Iran by Disability Age Under 5
In terms of disability age under 5, the demographic groups most similar to Immigrants from Iran are Yakama (1.00%, a difference of 0.080%), Indian (Asian) (1.0%, a difference of 0.36%), Immigrants from Micronesia (1.0%, a difference of 0.67%), British West Indian (0.99%, a difference of 0.79%), and Immigrants from Taiwan (1.0%, a difference of 0.79%).
| Demographics | Rating | Rank | Disability Age Under 5 |
| Immigrants | Hong Kong | 100.0 /100 | #15 | Exceptional 0.95% |
| Immigrants | Israel | 100.0 /100 | #16 | Exceptional 0.96% |
| Immigrants | China | 100.0 /100 | #17 | Exceptional 0.96% |
| Immigrants | Barbados | 100.0 /100 | #18 | Exceptional 0.97% |
| Puget Sound Salish | 100.0 /100 | #19 | Exceptional 0.97% |
| Nepalese | 100.0 /100 | #20 | Exceptional 0.97% |
| British West Indians | 100.0 /100 | #21 | Exceptional 0.99% |
| Immigrants | Iran | 100.0 /100 | #22 | Exceptional 1.00% |
| Yakama | 100.0 /100 | #23 | Exceptional 1.00% |
| Indians (Asian) | 100.0 /100 | #24 | Exceptional 1.0% |
| Immigrants | Micronesia | 100.0 /100 | #25 | Exceptional 1.0% |
| Immigrants | Taiwan | 100.0 /100 | #26 | Exceptional 1.0% |
| Guyanese | 100.0 /100 | #27 | Exceptional 1.0% |
| Immigrants | Eastern Asia | 100.0 /100 | #28 | Exceptional 1.0% |
| Immigrants | Belarus | 100.0 /100 | #29 | Exceptional 1.0% |