Immigrants from Guatemala vs Immigrants from Iran Disability Age Under 5
COMPARE
Immigrants from Guatemala
Immigrants from Iran
Disability Age Under 5
Disability Age Under 5 Comparison
Immigrants from Guatemala
Immigrants from Iran
1.2%
DISABILITY AGE UNDER 5
63.2/ 100
METRIC RATING
163rd/ 347
METRIC RANK
1.00%
DISABILITY AGE UNDER 5
100.0/ 100
METRIC RATING
22nd/ 347
METRIC RANK
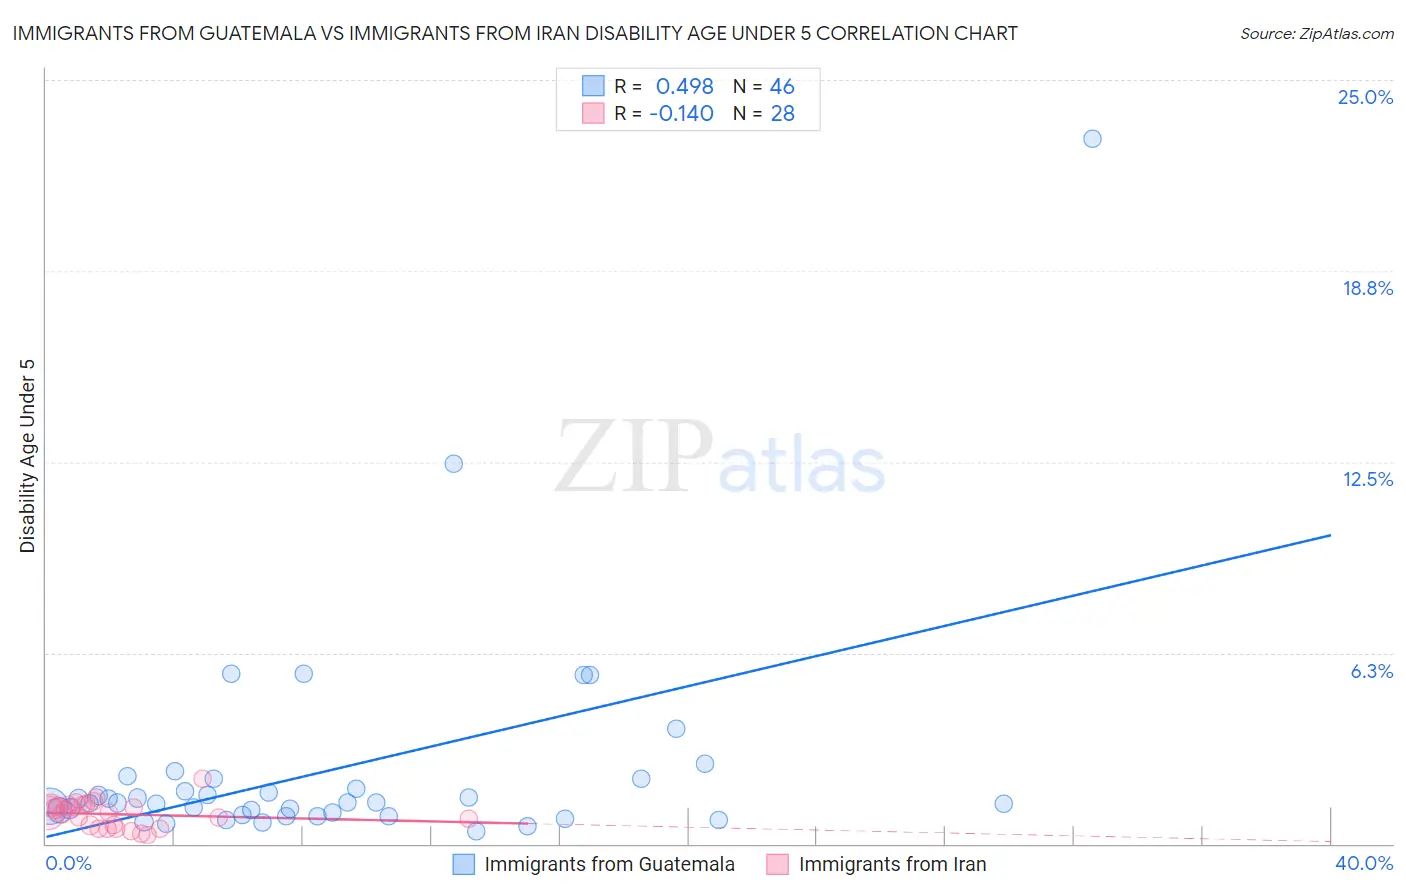
Immigrants from Guatemala vs Immigrants from Iran Disability Age Under 5 Correlation Chart
The statistical analysis conducted on geographies consisting of 214,173,088 people shows a moderate positive correlation between the proportion of Immigrants from Guatemala and percentage of population with a disability under the age of 5 in the United States with a correlation coefficient (R) of 0.498 and weighted average of 1.2%. Similarly, the statistical analysis conducted on geographies consisting of 168,672,244 people shows a poor negative correlation between the proportion of Immigrants from Iran and percentage of population with a disability under the age of 5 in the United States with a correlation coefficient (R) of -0.140 and weighted average of 1.00%, a difference of 22.7%.
Disability Age Under 5 Correlation Summary
| Measurement | Immigrants from Guatemala | Immigrants from Iran |
| Minimum | 0.42% | 0.30% |
| Maximum | 23.1% | 2.1% |
| Range | 22.7% | 1.8% |
| Mean | 2.4% | 0.97% |
| Median | 1.3% | 1.0% |
| Interquartile 25% (IQ1) | 0.93% | 0.54% |
| Interquartile 75% (IQ3) | 2.1% | 1.3% |
| Interquartile Range (IQR) | 1.2% | 0.73% |
| Standard Deviation (Sample) | 3.7% | 0.43% |
| Standard Deviation (Population) | 3.7% | 0.42% |
Similar Demographics by Disability Age Under 5
Demographics Similar to Immigrants from Guatemala by Disability Age Under 5
In terms of disability age under 5, the demographic groups most similar to Immigrants from Guatemala are Guatemalan (1.2%, a difference of 0.030%), Laotian (1.2%, a difference of 0.050%), Immigrants from Kuwait (1.2%, a difference of 0.070%), Immigrants from Central America (1.2%, a difference of 0.18%), and Immigrants from Africa (1.2%, a difference of 0.19%).
| Demographics | Rating | Rank | Disability Age Under 5 |
| Hawaiians | 68.5 /100 | #156 | Good 1.2% |
| Immigrants | South America | 67.0 /100 | #157 | Good 1.2% |
| Arabs | 66.4 /100 | #158 | Good 1.2% |
| Colombians | 65.8 /100 | #159 | Good 1.2% |
| Immigrants | Latin America | 65.8 /100 | #160 | Good 1.2% |
| Immigrants | Africa | 65.1 /100 | #161 | Good 1.2% |
| Guatemalans | 63.6 /100 | #162 | Good 1.2% |
| Immigrants | Guatemala | 63.2 /100 | #163 | Good 1.2% |
| Laotians | 62.8 /100 | #164 | Good 1.2% |
| Immigrants | Kuwait | 62.6 /100 | #165 | Good 1.2% |
| Immigrants | Central America | 61.4 /100 | #166 | Good 1.2% |
| Immigrants | Argentina | 60.2 /100 | #167 | Good 1.2% |
| Sierra Leoneans | 59.1 /100 | #168 | Average 1.2% |
| Immigrants | Uruguay | 59.0 /100 | #169 | Average 1.2% |
| Immigrants | Jamaica | 58.8 /100 | #170 | Average 1.2% |
Demographics Similar to Immigrants from Iran by Disability Age Under 5
In terms of disability age under 5, the demographic groups most similar to Immigrants from Iran are Yakama (1.00%, a difference of 0.080%), Indian (Asian) (1.0%, a difference of 0.36%), Immigrants from Micronesia (1.0%, a difference of 0.67%), British West Indian (0.99%, a difference of 0.79%), and Immigrants from Taiwan (1.0%, a difference of 0.79%).
| Demographics | Rating | Rank | Disability Age Under 5 |
| Immigrants | Hong Kong | 100.0 /100 | #15 | Exceptional 0.95% |
| Immigrants | Israel | 100.0 /100 | #16 | Exceptional 0.96% |
| Immigrants | China | 100.0 /100 | #17 | Exceptional 0.96% |
| Immigrants | Barbados | 100.0 /100 | #18 | Exceptional 0.97% |
| Puget Sound Salish | 100.0 /100 | #19 | Exceptional 0.97% |
| Nepalese | 100.0 /100 | #20 | Exceptional 0.97% |
| British West Indians | 100.0 /100 | #21 | Exceptional 0.99% |
| Immigrants | Iran | 100.0 /100 | #22 | Exceptional 1.00% |
| Yakama | 100.0 /100 | #23 | Exceptional 1.00% |
| Indians (Asian) | 100.0 /100 | #24 | Exceptional 1.0% |
| Immigrants | Micronesia | 100.0 /100 | #25 | Exceptional 1.0% |
| Immigrants | Taiwan | 100.0 /100 | #26 | Exceptional 1.0% |
| Guyanese | 100.0 /100 | #27 | Exceptional 1.0% |
| Immigrants | Eastern Asia | 100.0 /100 | #28 | Exceptional 1.0% |
| Immigrants | Belarus | 100.0 /100 | #29 | Exceptional 1.0% |