Slavic vs Alsatian Disability Age Under 5
COMPARE
Slavic
Alsatian
Disability Age Under 5
Disability Age Under 5 Comparison
Slavs
Alsatians
1.4%
DISABILITY AGE UNDER 5
0.3/ 100
METRIC RATING
260th/ 347
METRIC RANK
1.2%
DISABILITY AGE UNDER 5
79.3/ 100
METRIC RATING
143rd/ 347
METRIC RANK
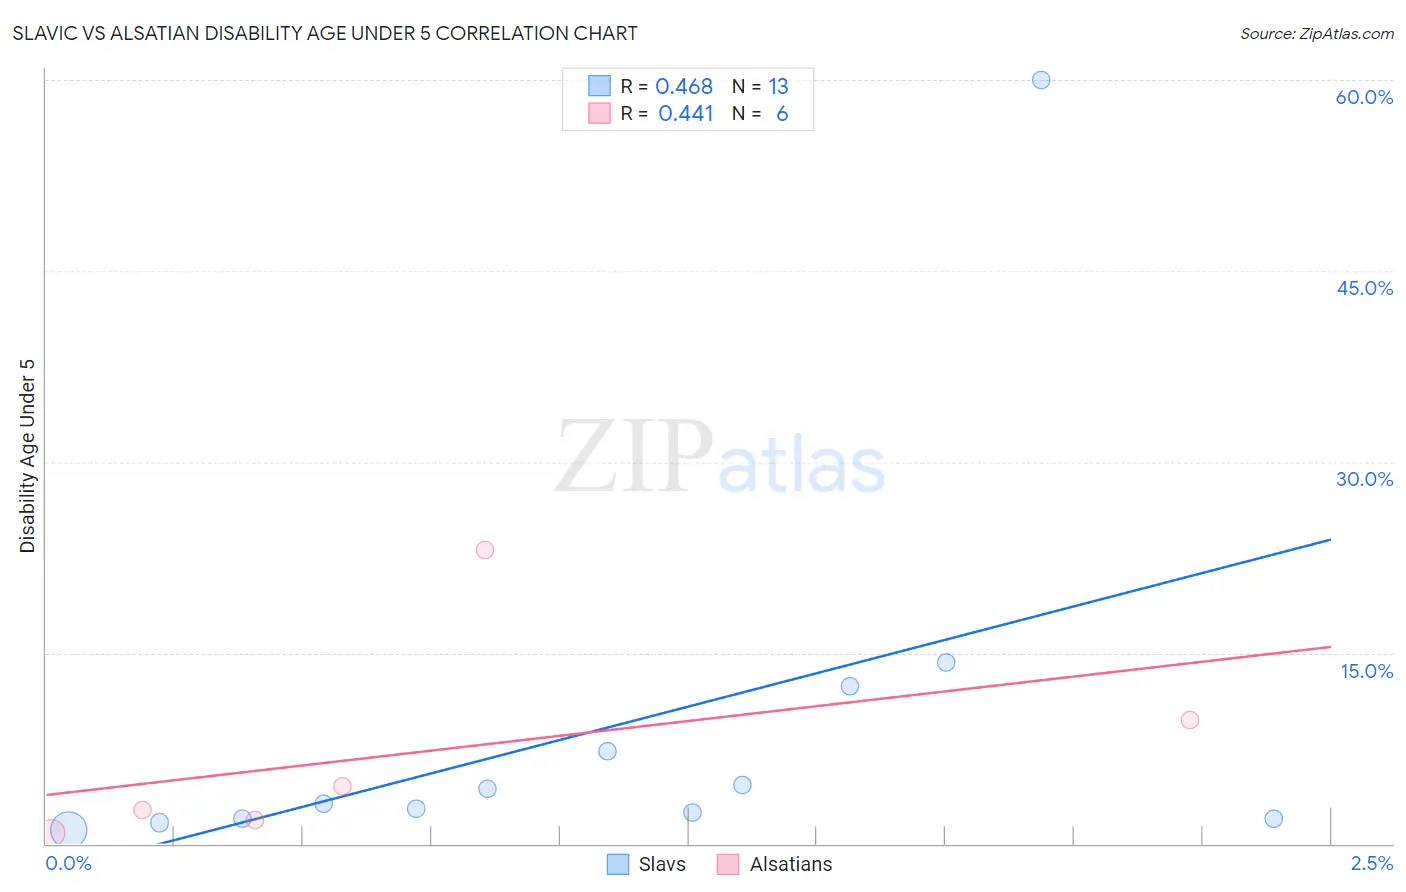
Slavic vs Alsatian Disability Age Under 5 Correlation Chart
The statistical analysis conducted on geographies consisting of 161,605,234 people shows a moderate positive correlation between the proportion of Slavs and percentage of population with a disability under the age of 5 in the United States with a correlation coefficient (R) of 0.468 and weighted average of 1.4%. Similarly, the statistical analysis conducted on geographies consisting of 65,109,236 people shows a moderate positive correlation between the proportion of Alsatians and percentage of population with a disability under the age of 5 in the United States with a correlation coefficient (R) of 0.441 and weighted average of 1.2%, a difference of 17.1%.
Disability Age Under 5 Correlation Summary
| Measurement | Slavic | Alsatian |
| Minimum | 1.0% | 0.86% |
| Maximum | 60.0% | 23.1% |
| Range | 59.0% | 22.3% |
| Mean | 9.1% | 7.1% |
| Median | 3.1% | 3.6% |
| Interquartile 25% (IQ1) | 2.0% | 1.9% |
| Interquartile 75% (IQ3) | 9.8% | 9.7% |
| Interquartile Range (IQR) | 7.8% | 7.8% |
| Standard Deviation (Sample) | 15.9% | 8.4% |
| Standard Deviation (Population) | 15.2% | 7.7% |
Similar Demographics by Disability Age Under 5
Demographics Similar to Slavs by Disability Age Under 5
In terms of disability age under 5, the demographic groups most similar to Slavs are Immigrants from Southern Europe (1.4%, a difference of 0.21%), Costa Rican (1.4%, a difference of 0.37%), Slovene (1.4%, a difference of 0.55%), Immigrants from Netherlands (1.4%, a difference of 0.67%), and Immigrants from Dominica (1.4%, a difference of 0.83%).
| Demographics | Rating | Rank | Disability Age Under 5 |
| Australians | 0.7 /100 | #253 | Tragic 1.4% |
| Immigrants | Brazil | 0.7 /100 | #254 | Tragic 1.4% |
| Immigrants | Liberia | 0.6 /100 | #255 | Tragic 1.4% |
| Immigrants | Western Europe | 0.5 /100 | #256 | Tragic 1.4% |
| Slovenes | 0.3 /100 | #257 | Tragic 1.4% |
| Costa Ricans | 0.3 /100 | #258 | Tragic 1.4% |
| Immigrants | Southern Europe | 0.3 /100 | #259 | Tragic 1.4% |
| Slavs | 0.3 /100 | #260 | Tragic 1.4% |
| Immigrants | Netherlands | 0.2 /100 | #261 | Tragic 1.4% |
| Immigrants | Dominica | 0.2 /100 | #262 | Tragic 1.4% |
| Spanish | 0.2 /100 | #263 | Tragic 1.4% |
| Yugoslavians | 0.1 /100 | #264 | Tragic 1.4% |
| Carpatho Rusyns | 0.1 /100 | #265 | Tragic 1.4% |
| Immigrants | Germany | 0.1 /100 | #266 | Tragic 1.4% |
| Cree | 0.1 /100 | #267 | Tragic 1.4% |
Demographics Similar to Alsatians by Disability Age Under 5
In terms of disability age under 5, the demographic groups most similar to Alsatians are Immigrants from Middle Africa (1.2%, a difference of 0.0%), Immigrants from Colombia (1.2%, a difference of 0.010%), Immigrants from Honduras (1.2%, a difference of 0.16%), Immigrants from Zimbabwe (1.2%, a difference of 0.19%), and Somali (1.2%, a difference of 0.22%).
| Demographics | Rating | Rank | Disability Age Under 5 |
| Moroccans | 83.6 /100 | #136 | Excellent 1.2% |
| Immigrants | Eastern Africa | 83.1 /100 | #137 | Excellent 1.2% |
| Immigrants | Czechoslovakia | 82.8 /100 | #138 | Excellent 1.2% |
| New Zealanders | 81.4 /100 | #139 | Excellent 1.2% |
| Somalis | 80.8 /100 | #140 | Excellent 1.2% |
| Immigrants | Honduras | 80.4 /100 | #141 | Excellent 1.2% |
| Immigrants | Colombia | 79.3 /100 | #142 | Good 1.2% |
| Alsatians | 79.3 /100 | #143 | Good 1.2% |
| Immigrants | Middle Africa | 79.3 /100 | #144 | Good 1.2% |
| Immigrants | Zimbabwe | 77.9 /100 | #145 | Good 1.2% |
| Samoans | 77.7 /100 | #146 | Good 1.2% |
| Icelanders | 76.3 /100 | #147 | Good 1.2% |
| Ghanaians | 76.3 /100 | #148 | Good 1.2% |
| Kenyans | 75.9 /100 | #149 | Good 1.2% |
| South Americans | 75.6 /100 | #150 | Good 1.2% |