Slavic vs Immigrants from Korea Male Disability
COMPARE
Slavic
Immigrants from Korea
Male Disability
Male Disability Comparison
Slavs
Immigrants from Korea
12.2%
MALE DISABILITY
0.2/ 100
METRIC RATING
261st/ 347
METRIC RANK
9.8%
MALE DISABILITY
100.0/ 100
METRIC RATING
17th/ 347
METRIC RANK
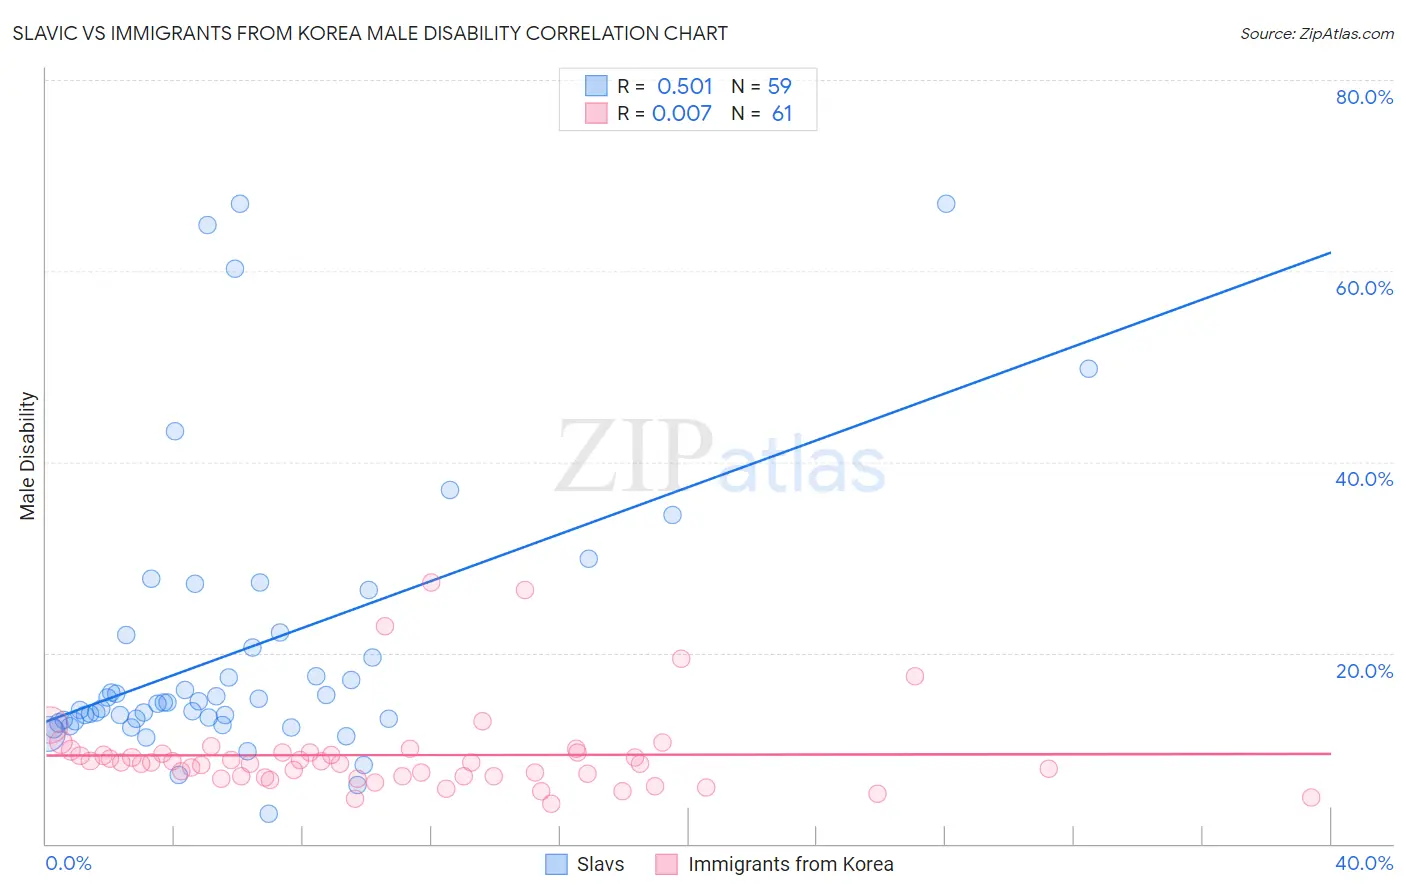
Slavic vs Immigrants from Korea Male Disability Correlation Chart
The statistical analysis conducted on geographies consisting of 270,856,634 people shows a substantial positive correlation between the proportion of Slavs and percentage of males with a disability in the United States with a correlation coefficient (R) of 0.501 and weighted average of 12.2%. Similarly, the statistical analysis conducted on geographies consisting of 416,248,293 people shows no correlation between the proportion of Immigrants from Korea and percentage of males with a disability in the United States with a correlation coefficient (R) of 0.007 and weighted average of 9.8%, a difference of 24.4%.
Male Disability Correlation Summary
| Measurement | Slavic | Immigrants from Korea |
| Minimum | 3.2% | 4.2% |
| Maximum | 67.0% | 27.3% |
| Range | 63.9% | 23.1% |
| Mean | 20.3% | 9.3% |
| Median | 14.8% | 8.5% |
| Interquartile 25% (IQ1) | 12.8% | 7.0% |
| Interquartile 75% (IQ3) | 21.9% | 9.6% |
| Interquartile Range (IQR) | 9.1% | 2.5% |
| Standard Deviation (Sample) | 14.7% | 4.5% |
| Standard Deviation (Population) | 14.6% | 4.5% |
Similar Demographics by Male Disability
Demographics Similar to Slavs by Male Disability
In terms of male disability, the demographic groups most similar to Slavs are Norwegian (12.2%, a difference of 0.010%), Canadian (12.2%, a difference of 0.21%), Nepalese (12.2%, a difference of 0.25%), Swedish (12.1%, a difference of 0.36%), and Belgian (12.1%, a difference of 0.43%).
| Demographics | Rating | Rank | Male Disability |
| British | 0.4 /100 | #254 | Tragic 12.1% |
| Chinese | 0.4 /100 | #255 | Tragic 12.1% |
| Swiss | 0.3 /100 | #256 | Tragic 12.1% |
| Europeans | 0.3 /100 | #257 | Tragic 12.1% |
| Basques | 0.3 /100 | #258 | Tragic 12.1% |
| Belgians | 0.3 /100 | #259 | Tragic 12.1% |
| Swedes | 0.3 /100 | #260 | Tragic 12.1% |
| Slavs | 0.2 /100 | #261 | Tragic 12.2% |
| Norwegians | 0.2 /100 | #262 | Tragic 12.2% |
| Canadians | 0.2 /100 | #263 | Tragic 12.2% |
| Nepalese | 0.2 /100 | #264 | Tragic 12.2% |
| Immigrants | Portugal | 0.1 /100 | #265 | Tragic 12.3% |
| Hawaiians | 0.1 /100 | #266 | Tragic 12.3% |
| Immigrants | Germany | 0.1 /100 | #267 | Tragic 12.3% |
| Portuguese | 0.1 /100 | #268 | Tragic 12.3% |
Demographics Similar to Immigrants from Korea by Male Disability
In terms of male disability, the demographic groups most similar to Immigrants from Korea are Okinawan (9.8%, a difference of 0.14%), Immigrants from Pakistan (9.8%, a difference of 0.56%), Indian (Asian) (9.7%, a difference of 0.75%), Immigrants from Iran (9.7%, a difference of 1.2%), and Iranian (9.7%, a difference of 1.3%).
| Demographics | Rating | Rank | Male Disability |
| Immigrants | Israel | 100.0 /100 | #10 | Exceptional 9.6% |
| Immigrants | Eastern Asia | 100.0 /100 | #11 | Exceptional 9.6% |
| Bolivians | 100.0 /100 | #12 | Exceptional 9.6% |
| Iranians | 100.0 /100 | #13 | Exceptional 9.7% |
| Immigrants | Iran | 100.0 /100 | #14 | Exceptional 9.7% |
| Indians (Asian) | 100.0 /100 | #15 | Exceptional 9.7% |
| Okinawans | 100.0 /100 | #16 | Exceptional 9.8% |
| Immigrants | Korea | 100.0 /100 | #17 | Exceptional 9.8% |
| Immigrants | Pakistan | 100.0 /100 | #18 | Exceptional 9.8% |
| Immigrants | Sri Lanka | 100.0 /100 | #19 | Exceptional 10.0% |
| Asians | 100.0 /100 | #20 | Exceptional 10.0% |
| Burmese | 100.0 /100 | #21 | Exceptional 10.0% |
| Immigrants | Venezuela | 100.0 /100 | #22 | Exceptional 10.0% |
| Cypriots | 100.0 /100 | #23 | Exceptional 10.0% |
| Immigrants | Asia | 100.0 /100 | #24 | Exceptional 10.0% |