Slavic vs Ute Male Disability
COMPARE
Slavic
Ute
Male Disability
Male Disability Comparison
Slavs
Ute
12.2%
MALE DISABILITY
0.2/ 100
METRIC RATING
261st/ 347
METRIC RANK
11.6%
MALE DISABILITY
9.4/ 100
METRIC RATING
210th/ 347
METRIC RANK
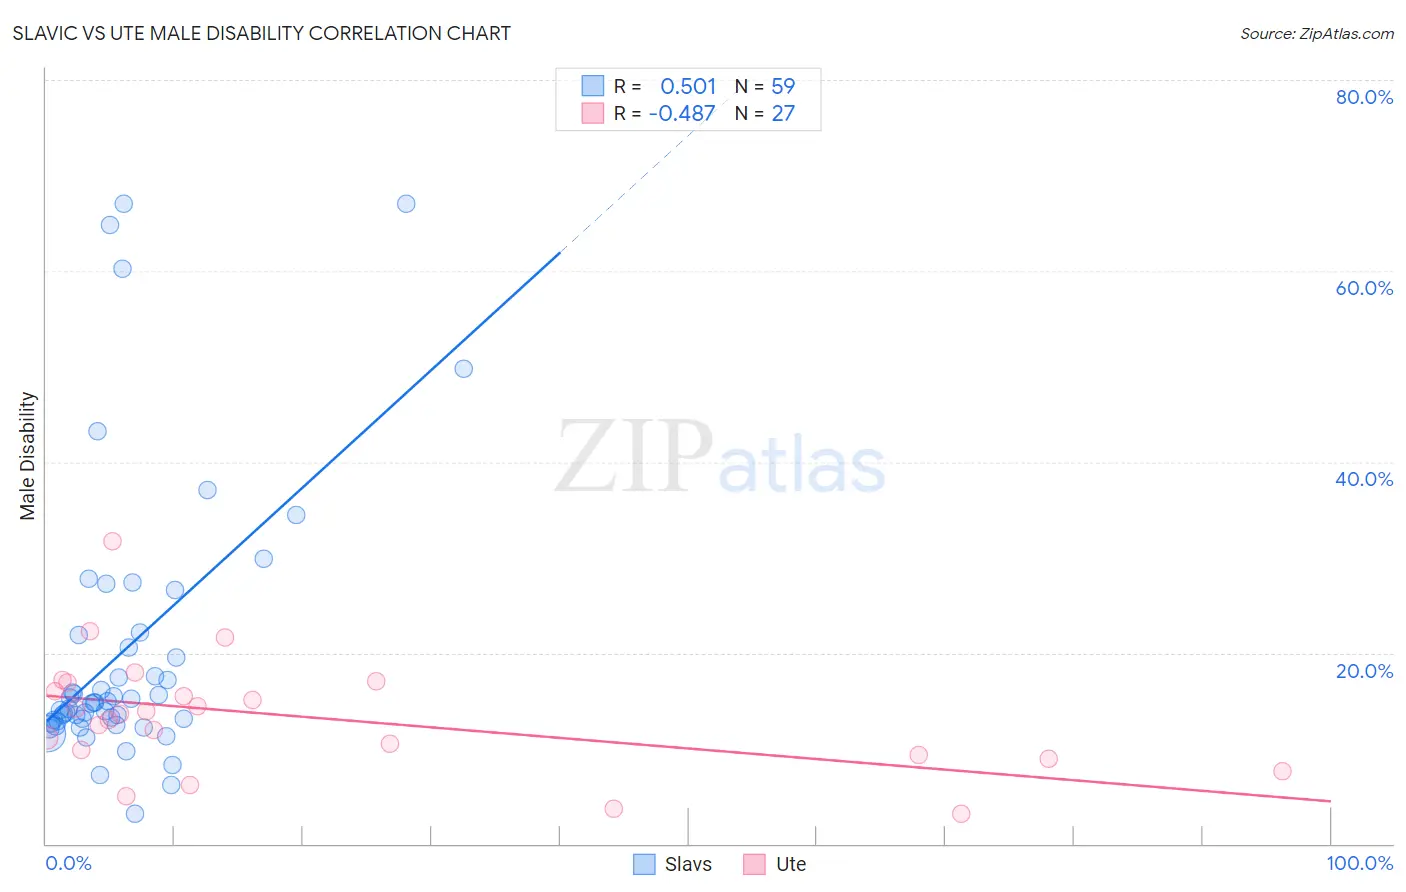
Slavic vs Ute Male Disability Correlation Chart
The statistical analysis conducted on geographies consisting of 270,856,634 people shows a substantial positive correlation between the proportion of Slavs and percentage of males with a disability in the United States with a correlation coefficient (R) of 0.501 and weighted average of 12.2%. Similarly, the statistical analysis conducted on geographies consisting of 55,667,753 people shows a moderate negative correlation between the proportion of Ute and percentage of males with a disability in the United States with a correlation coefficient (R) of -0.487 and weighted average of 11.6%, a difference of 5.3%.
Male Disability Correlation Summary
| Measurement | Slavic | Ute |
| Minimum | 3.2% | 3.1% |
| Maximum | 67.0% | 31.7% |
| Range | 63.9% | 28.5% |
| Mean | 20.3% | 13.3% |
| Median | 14.8% | 13.6% |
| Interquartile 25% (IQ1) | 12.8% | 9.3% |
| Interquartile 75% (IQ3) | 21.9% | 16.9% |
| Interquartile Range (IQR) | 9.1% | 7.6% |
| Standard Deviation (Sample) | 14.7% | 6.1% |
| Standard Deviation (Population) | 14.6% | 6.0% |
Similar Demographics by Male Disability
Demographics Similar to Slavs by Male Disability
In terms of male disability, the demographic groups most similar to Slavs are Norwegian (12.2%, a difference of 0.010%), Canadian (12.2%, a difference of 0.21%), Nepalese (12.2%, a difference of 0.25%), Swedish (12.1%, a difference of 0.36%), and Belgian (12.1%, a difference of 0.43%).
| Demographics | Rating | Rank | Male Disability |
| British | 0.4 /100 | #254 | Tragic 12.1% |
| Chinese | 0.4 /100 | #255 | Tragic 12.1% |
| Swiss | 0.3 /100 | #256 | Tragic 12.1% |
| Europeans | 0.3 /100 | #257 | Tragic 12.1% |
| Basques | 0.3 /100 | #258 | Tragic 12.1% |
| Belgians | 0.3 /100 | #259 | Tragic 12.1% |
| Swedes | 0.3 /100 | #260 | Tragic 12.1% |
| Slavs | 0.2 /100 | #261 | Tragic 12.2% |
| Norwegians | 0.2 /100 | #262 | Tragic 12.2% |
| Canadians | 0.2 /100 | #263 | Tragic 12.2% |
| Nepalese | 0.2 /100 | #264 | Tragic 12.2% |
| Immigrants | Portugal | 0.1 /100 | #265 | Tragic 12.3% |
| Hawaiians | 0.1 /100 | #266 | Tragic 12.3% |
| Immigrants | Germany | 0.1 /100 | #267 | Tragic 12.3% |
| Portuguese | 0.1 /100 | #268 | Tragic 12.3% |
Demographics Similar to Ute by Male Disability
In terms of male disability, the demographic groups most similar to Ute are Spanish American Indian (11.6%, a difference of 0.10%), Icelander (11.6%, a difference of 0.11%), Immigrants from Somalia (11.5%, a difference of 0.15%), Immigrants from Thailand (11.6%, a difference of 0.17%), and Ukrainian (11.5%, a difference of 0.18%).
| Demographics | Rating | Rank | Male Disability |
| Jamaicans | 10.9 /100 | #203 | Poor 11.5% |
| Immigrants | Cambodia | 10.8 /100 | #204 | Poor 11.5% |
| Serbians | 10.7 /100 | #205 | Poor 11.5% |
| Ukrainians | 10.6 /100 | #206 | Poor 11.5% |
| Immigrants | Somalia | 10.4 /100 | #207 | Poor 11.5% |
| Icelanders | 10.1 /100 | #208 | Poor 11.6% |
| Spanish American Indians | 10.1 /100 | #209 | Poor 11.6% |
| Ute | 9.4 /100 | #210 | Tragic 11.6% |
| Immigrants | Thailand | 8.4 /100 | #211 | Tragic 11.6% |
| Immigrants | Scotland | 8.2 /100 | #212 | Tragic 11.6% |
| Mexican American Indians | 7.8 /100 | #213 | Tragic 11.6% |
| Lithuanians | 6.6 /100 | #214 | Tragic 11.6% |
| Indonesians | 5.9 /100 | #215 | Tragic 11.6% |
| Immigrants | Dominican Republic | 4.9 /100 | #216 | Tragic 11.7% |
| Immigrants | Dominica | 4.6 /100 | #217 | Tragic 11.7% |