Sioux vs Menominee Vision Disability
COMPARE
Sioux
Menominee
Vision Disability
Vision Disability Comparison
Sioux
Menominee
2.5%
VISION DISABILITY
0.0/ 100
METRIC RATING
286th/ 347
METRIC RANK
2.5%
VISION DISABILITY
0.0/ 100
METRIC RATING
301st/ 347
METRIC RANK
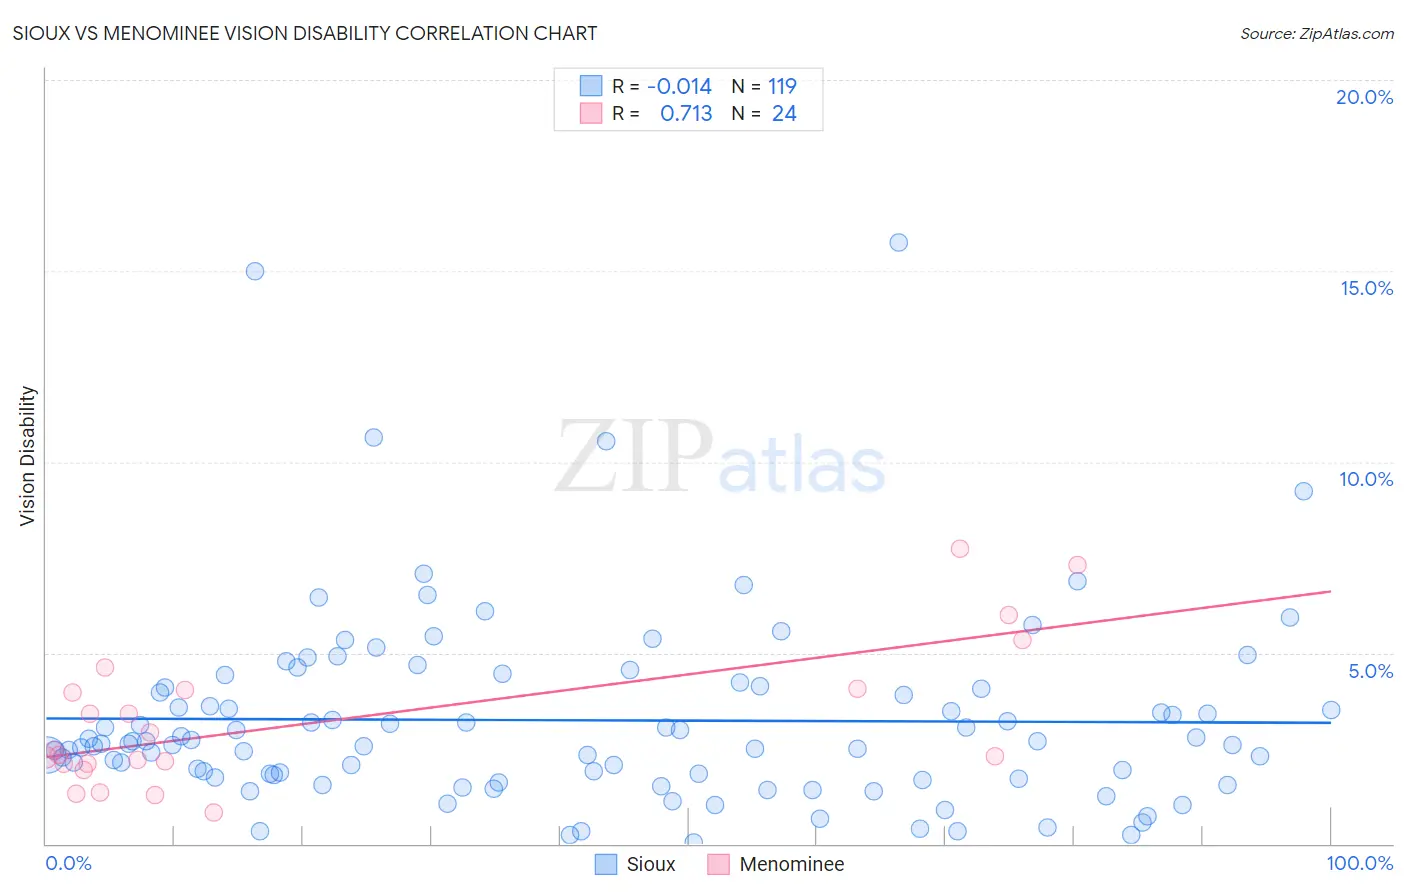
Sioux vs Menominee Vision Disability Correlation Chart
The statistical analysis conducted on geographies consisting of 234,049,152 people shows no correlation between the proportion of Sioux and percentage of population with vision disability in the United States with a correlation coefficient (R) of -0.014 and weighted average of 2.5%. Similarly, the statistical analysis conducted on geographies consisting of 45,774,970 people shows a strong positive correlation between the proportion of Menominee and percentage of population with vision disability in the United States with a correlation coefficient (R) of 0.713 and weighted average of 2.5%, a difference of 3.2%.
Vision Disability Correlation Summary
| Measurement | Sioux | Menominee |
| Minimum | 0.034% | 0.83% |
| Maximum | 15.7% | 7.7% |
| Range | 15.7% | 6.9% |
| Mean | 3.2% | 3.2% |
| Median | 2.6% | 2.4% |
| Interquartile 25% (IQ1) | 1.7% | 2.1% |
| Interquartile 75% (IQ3) | 4.1% | 4.0% |
| Interquartile Range (IQR) | 2.3% | 1.9% |
| Standard Deviation (Sample) | 2.5% | 1.9% |
| Standard Deviation (Population) | 2.5% | 1.8% |
Demographics Similar to Sioux and Menominee by Vision Disability
In terms of vision disability, the demographic groups most similar to Sioux are Immigrants from Central America (2.5%, a difference of 0.010%), Yakama (2.5%, a difference of 0.030%), Honduran (2.5%, a difference of 0.14%), French American Indian (2.5%, a difference of 0.17%), and Puget Sound Salish (2.5%, a difference of 0.31%). Similarly, the demographic groups most similar to Menominee are African (2.5%, a difference of 0.18%), Cree (2.5%, a difference of 0.38%), Mexican (2.5%, a difference of 0.41%), Immigrants from Dominica (2.5%, a difference of 0.55%), and Immigrants from Mexico (2.5%, a difference of 1.2%).
| Demographics | Rating | Rank | Vision Disability |
| Puget Sound Salish | 0.0 /100 | #283 | Tragic 2.5% |
| Yakama | 0.0 /100 | #284 | Tragic 2.5% |
| Immigrants | Central America | 0.0 /100 | #285 | Tragic 2.5% |
| Sioux | 0.0 /100 | #286 | Tragic 2.5% |
| Hondurans | 0.0 /100 | #287 | Tragic 2.5% |
| French American Indians | 0.0 /100 | #288 | Tragic 2.5% |
| Immigrants | Nonimmigrants | 0.0 /100 | #289 | Tragic 2.5% |
| Immigrants | Cuba | 0.0 /100 | #290 | Tragic 2.5% |
| Immigrants | Honduras | 0.0 /100 | #291 | Tragic 2.5% |
| Crow | 0.0 /100 | #292 | Tragic 2.5% |
| Yaqui | 0.0 /100 | #293 | Tragic 2.5% |
| Ottawa | 0.0 /100 | #294 | Tragic 2.5% |
| Delaware | 0.0 /100 | #295 | Tragic 2.5% |
| Immigrants | Mexico | 0.0 /100 | #296 | Tragic 2.5% |
| Immigrants | Dominica | 0.0 /100 | #297 | Tragic 2.5% |
| Mexicans | 0.0 /100 | #298 | Tragic 2.5% |
| Cree | 0.0 /100 | #299 | Tragic 2.5% |
| Africans | 0.0 /100 | #300 | Tragic 2.5% |
| Menominee | 0.0 /100 | #301 | Tragic 2.5% |
| Spanish American Indians | 0.0 /100 | #302 | Tragic 2.6% |
| Immigrants | Cabo Verde | 0.0 /100 | #303 | Tragic 2.6% |