Immigrants from Russia vs Menominee Vision Disability
COMPARE
Immigrants from Russia
Menominee
Vision Disability
Vision Disability Comparison
Immigrants from Russia
Menominee
2.0%
VISION DISABILITY
99.1/ 100
METRIC RATING
62nd/ 347
METRIC RANK
2.5%
VISION DISABILITY
0.0/ 100
METRIC RATING
301st/ 347
METRIC RANK
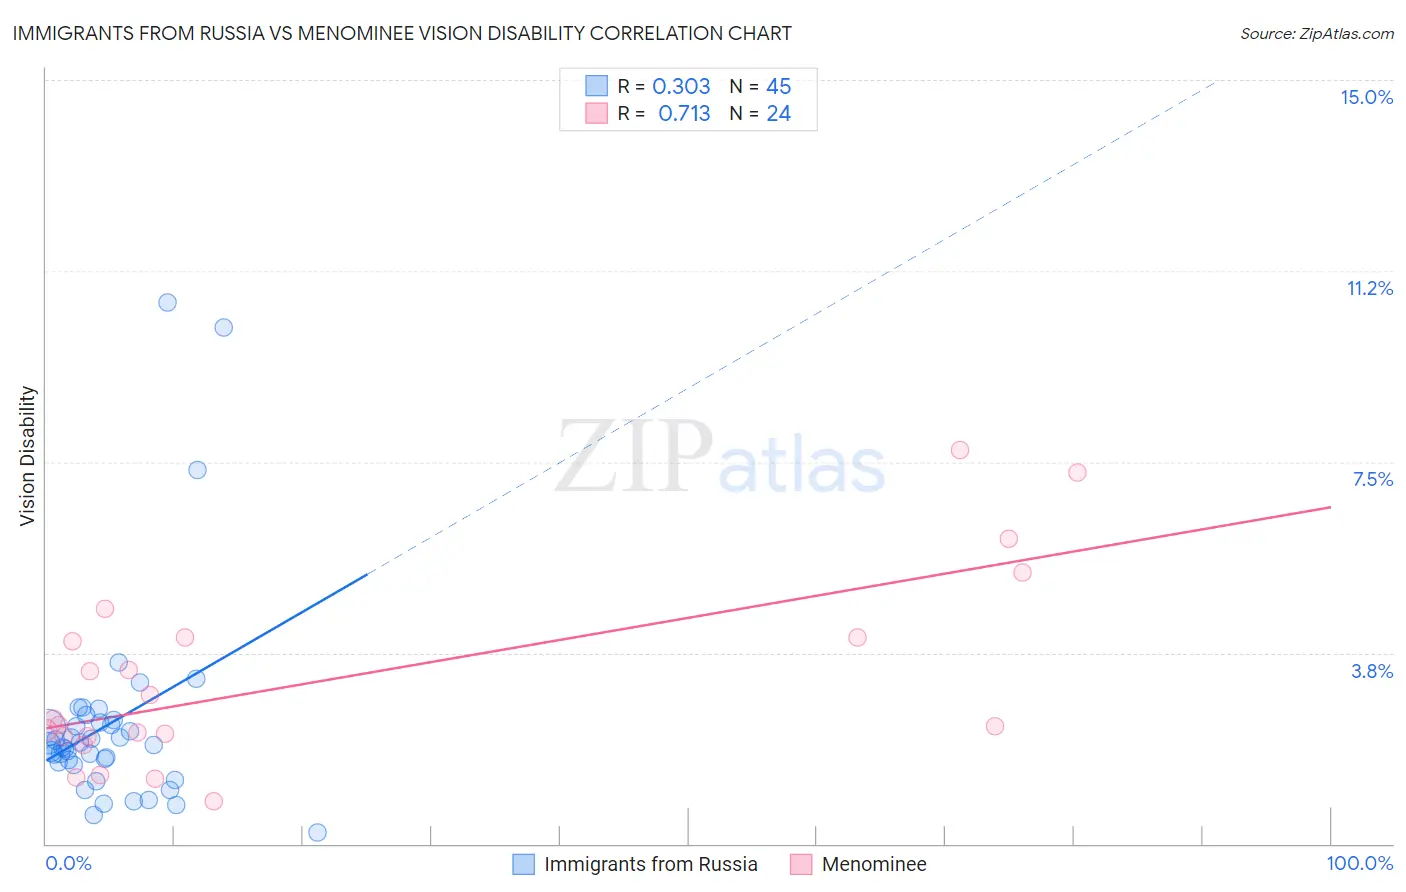
Immigrants from Russia vs Menominee Vision Disability Correlation Chart
The statistical analysis conducted on geographies consisting of 347,675,214 people shows a mild positive correlation between the proportion of Immigrants from Russia and percentage of population with vision disability in the United States with a correlation coefficient (R) of 0.303 and weighted average of 2.0%. Similarly, the statistical analysis conducted on geographies consisting of 45,774,970 people shows a strong positive correlation between the proportion of Menominee and percentage of population with vision disability in the United States with a correlation coefficient (R) of 0.713 and weighted average of 2.5%, a difference of 26.8%.
Vision Disability Correlation Summary
| Measurement | Immigrants from Russia | Menominee |
| Minimum | 0.22% | 0.83% |
| Maximum | 10.6% | 7.7% |
| Range | 10.4% | 6.9% |
| Mean | 2.4% | 3.2% |
| Median | 1.9% | 2.4% |
| Interquartile 25% (IQ1) | 1.6% | 2.1% |
| Interquartile 75% (IQ3) | 2.4% | 4.0% |
| Interquartile Range (IQR) | 0.85% | 1.9% |
| Standard Deviation (Sample) | 2.1% | 1.9% |
| Standard Deviation (Population) | 2.0% | 1.8% |
Similar Demographics by Vision Disability
Demographics Similar to Immigrants from Russia by Vision Disability
In terms of vision disability, the demographic groups most similar to Immigrants from Russia are Immigrants from Belgium (2.0%, a difference of 0.020%), Immigrants from Romania (2.0%, a difference of 0.030%), Argentinean (2.0%, a difference of 0.060%), Armenian (2.0%, a difference of 0.11%), and Immigrants from Saudi Arabia (2.0%, a difference of 0.21%).
| Demographics | Rating | Rank | Vision Disability |
| Laotians | 99.3 /100 | #55 | Exceptional 2.0% |
| Jordanians | 99.2 /100 | #56 | Exceptional 2.0% |
| Somalis | 99.2 /100 | #57 | Exceptional 2.0% |
| Immigrants | Saudi Arabia | 99.2 /100 | #58 | Exceptional 2.0% |
| Argentineans | 99.1 /100 | #59 | Exceptional 2.0% |
| Immigrants | Romania | 99.1 /100 | #60 | Exceptional 2.0% |
| Immigrants | Belgium | 99.1 /100 | #61 | Exceptional 2.0% |
| Immigrants | Russia | 99.1 /100 | #62 | Exceptional 2.0% |
| Armenians | 99.0 /100 | #63 | Exceptional 2.0% |
| Immigrants | Greece | 99.0 /100 | #64 | Exceptional 2.0% |
| Maltese | 98.9 /100 | #65 | Exceptional 2.0% |
| Immigrants | Argentina | 98.9 /100 | #66 | Exceptional 2.0% |
| Immigrants | Northern Africa | 98.8 /100 | #67 | Exceptional 2.0% |
| Immigrants | Czechoslovakia | 98.7 /100 | #68 | Exceptional 2.0% |
| Russians | 98.6 /100 | #69 | Exceptional 2.0% |
Demographics Similar to Menominee by Vision Disability
In terms of vision disability, the demographic groups most similar to Menominee are African (2.5%, a difference of 0.18%), Cree (2.5%, a difference of 0.38%), Mexican (2.5%, a difference of 0.41%), Immigrants from Dominica (2.5%, a difference of 0.55%), and Immigrants from Mexico (2.5%, a difference of 1.2%).
| Demographics | Rating | Rank | Vision Disability |
| Ottawa | 0.0 /100 | #294 | Tragic 2.5% |
| Delaware | 0.0 /100 | #295 | Tragic 2.5% |
| Immigrants | Mexico | 0.0 /100 | #296 | Tragic 2.5% |
| Immigrants | Dominica | 0.0 /100 | #297 | Tragic 2.5% |
| Mexicans | 0.0 /100 | #298 | Tragic 2.5% |
| Cree | 0.0 /100 | #299 | Tragic 2.5% |
| Africans | 0.0 /100 | #300 | Tragic 2.5% |
| Menominee | 0.0 /100 | #301 | Tragic 2.5% |
| Spanish American Indians | 0.0 /100 | #302 | Tragic 2.6% |
| Immigrants | Cabo Verde | 0.0 /100 | #303 | Tragic 2.6% |
| Aleuts | 0.0 /100 | #304 | Tragic 2.6% |
| Hispanics or Latinos | 0.0 /100 | #305 | Tragic 2.6% |
| Iroquois | 0.0 /100 | #306 | Tragic 2.6% |
| Immigrants | Dominican Republic | 0.0 /100 | #307 | Tragic 2.6% |
| Arapaho | 0.0 /100 | #308 | Tragic 2.6% |