Sioux vs Apache Vision Disability
COMPARE
Sioux
Apache
Vision Disability
Vision Disability Comparison
Sioux
Apache
2.5%
VISION DISABILITY
0.0/ 100
METRIC RATING
286th/ 347
METRIC RANK
3.0%
VISION DISABILITY
0.0/ 100
METRIC RATING
329th/ 347
METRIC RANK
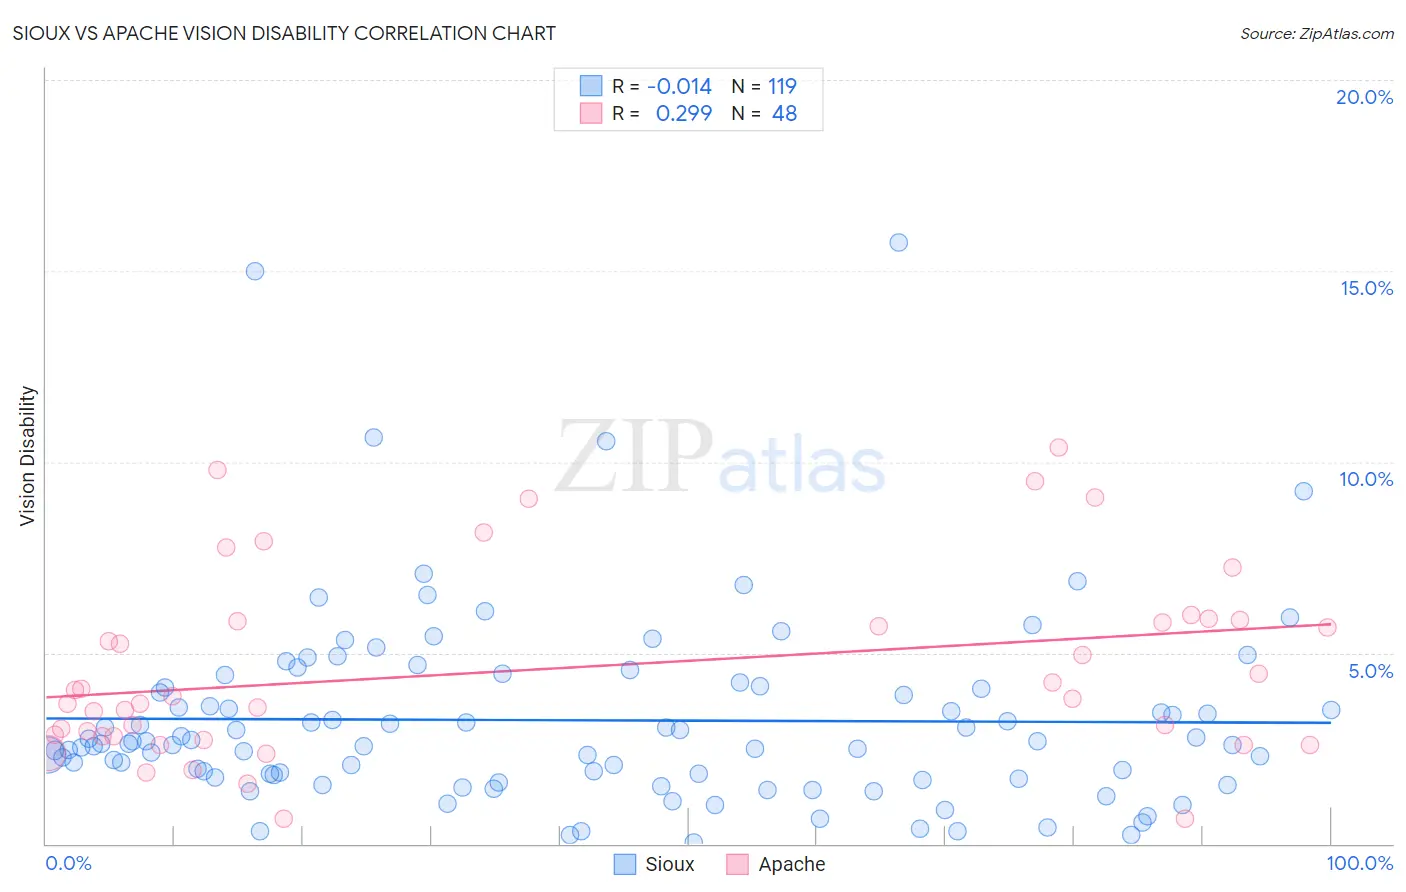
Sioux vs Apache Vision Disability Correlation Chart
The statistical analysis conducted on geographies consisting of 234,049,152 people shows no correlation between the proportion of Sioux and percentage of population with vision disability in the United States with a correlation coefficient (R) of -0.014 and weighted average of 2.5%. Similarly, the statistical analysis conducted on geographies consisting of 231,003,425 people shows a weak positive correlation between the proportion of Apache and percentage of population with vision disability in the United States with a correlation coefficient (R) of 0.299 and weighted average of 3.0%, a difference of 21.3%.
Vision Disability Correlation Summary
| Measurement | Sioux | Apache |
| Minimum | 0.034% | 0.65% |
| Maximum | 15.7% | 10.4% |
| Range | 15.7% | 9.7% |
| Mean | 3.2% | 4.6% |
| Median | 2.6% | 3.8% |
| Interquartile 25% (IQ1) | 1.7% | 2.8% |
| Interquartile 75% (IQ3) | 4.1% | 5.8% |
| Interquartile Range (IQR) | 2.3% | 3.0% |
| Standard Deviation (Sample) | 2.5% | 2.5% |
| Standard Deviation (Population) | 2.5% | 2.4% |
Similar Demographics by Vision Disability
Demographics Similar to Sioux by Vision Disability
In terms of vision disability, the demographic groups most similar to Sioux are Immigrants from Central America (2.5%, a difference of 0.010%), Yakama (2.5%, a difference of 0.030%), Honduran (2.5%, a difference of 0.14%), French American Indian (2.5%, a difference of 0.17%), and Puget Sound Salish (2.5%, a difference of 0.31%).
| Demographics | Rating | Rank | Vision Disability |
| Nepalese | 0.0 /100 | #279 | Tragic 2.4% |
| Cape Verdeans | 0.0 /100 | #280 | Tragic 2.4% |
| U.S. Virgin Islanders | 0.0 /100 | #281 | Tragic 2.5% |
| Immigrants | Caribbean | 0.0 /100 | #282 | Tragic 2.5% |
| Puget Sound Salish | 0.0 /100 | #283 | Tragic 2.5% |
| Yakama | 0.0 /100 | #284 | Tragic 2.5% |
| Immigrants | Central America | 0.0 /100 | #285 | Tragic 2.5% |
| Sioux | 0.0 /100 | #286 | Tragic 2.5% |
| Hondurans | 0.0 /100 | #287 | Tragic 2.5% |
| French American Indians | 0.0 /100 | #288 | Tragic 2.5% |
| Immigrants | Nonimmigrants | 0.0 /100 | #289 | Tragic 2.5% |
| Immigrants | Cuba | 0.0 /100 | #290 | Tragic 2.5% |
| Immigrants | Honduras | 0.0 /100 | #291 | Tragic 2.5% |
| Crow | 0.0 /100 | #292 | Tragic 2.5% |
| Yaqui | 0.0 /100 | #293 | Tragic 2.5% |
Demographics Similar to Apache by Vision Disability
In terms of vision disability, the demographic groups most similar to Apache are Yuman (3.0%, a difference of 0.19%), Native/Alaskan (3.0%, a difference of 0.74%), Colville (3.0%, a difference of 1.2%), Spanish American (2.9%, a difference of 1.5%), and Central American Indian (3.0%, a difference of 1.8%).
| Demographics | Rating | Rank | Vision Disability |
| Paiute | 0.0 /100 | #322 | Tragic 2.9% |
| Tlingit-Haida | 0.0 /100 | #323 | Tragic 2.9% |
| Hopi | 0.0 /100 | #324 | Tragic 2.9% |
| Cherokee | 0.0 /100 | #325 | Tragic 2.9% |
| Spanish Americans | 0.0 /100 | #326 | Tragic 2.9% |
| Natives/Alaskans | 0.0 /100 | #327 | Tragic 3.0% |
| Yuman | 0.0 /100 | #328 | Tragic 3.0% |
| Apache | 0.0 /100 | #329 | Tragic 3.0% |
| Colville | 0.0 /100 | #330 | Tragic 3.0% |
| Central American Indians | 0.0 /100 | #331 | Tragic 3.0% |
| Seminole | 0.0 /100 | #332 | Tragic 3.1% |
| Cajuns | 0.0 /100 | #333 | Tragic 3.1% |
| Cheyenne | 0.0 /100 | #334 | Tragic 3.1% |
| Navajo | 0.0 /100 | #335 | Tragic 3.1% |
| Alaskan Athabascans | 0.0 /100 | #336 | Tragic 3.1% |