Sioux vs Turkish Vision Disability
COMPARE
Sioux
Turkish
Vision Disability
Vision Disability Comparison
Sioux
Turks
2.5%
VISION DISABILITY
0.0/ 100
METRIC RATING
286th/ 347
METRIC RANK
1.9%
VISION DISABILITY
100.0/ 100
METRIC RATING
21st/ 347
METRIC RANK
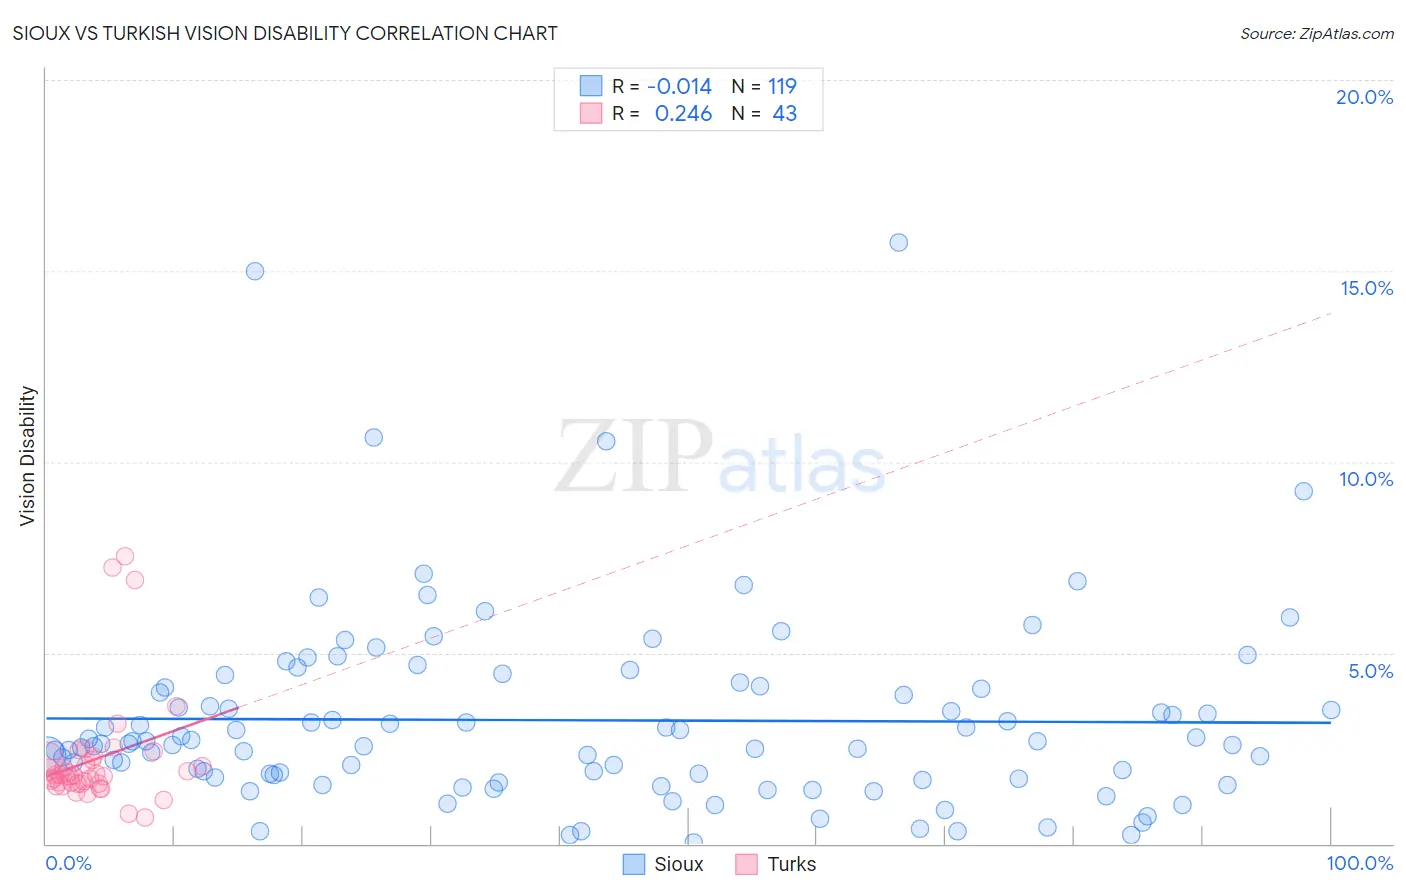
Sioux vs Turkish Vision Disability Correlation Chart
The statistical analysis conducted on geographies consisting of 234,049,152 people shows no correlation between the proportion of Sioux and percentage of population with vision disability in the United States with a correlation coefficient (R) of -0.014 and weighted average of 2.5%. Similarly, the statistical analysis conducted on geographies consisting of 271,748,480 people shows a weak positive correlation between the proportion of Turks and percentage of population with vision disability in the United States with a correlation coefficient (R) of 0.246 and weighted average of 1.9%, a difference of 29.3%.
Vision Disability Correlation Summary
| Measurement | Sioux | Turkish |
| Minimum | 0.034% | 0.70% |
| Maximum | 15.7% | 7.5% |
| Range | 15.7% | 6.8% |
| Mean | 3.2% | 2.2% |
| Median | 2.6% | 1.8% |
| Interquartile 25% (IQ1) | 1.7% | 1.6% |
| Interquartile 75% (IQ3) | 4.1% | 2.2% |
| Interquartile Range (IQR) | 2.3% | 0.65% |
| Standard Deviation (Sample) | 2.5% | 1.5% |
| Standard Deviation (Population) | 2.5% | 1.5% |
Similar Demographics by Vision Disability
Demographics Similar to Sioux by Vision Disability
In terms of vision disability, the demographic groups most similar to Sioux are Immigrants from Central America (2.5%, a difference of 0.010%), Yakama (2.5%, a difference of 0.030%), Honduran (2.5%, a difference of 0.14%), French American Indian (2.5%, a difference of 0.17%), and Puget Sound Salish (2.5%, a difference of 0.31%).
| Demographics | Rating | Rank | Vision Disability |
| Nepalese | 0.0 /100 | #279 | Tragic 2.4% |
| Cape Verdeans | 0.0 /100 | #280 | Tragic 2.4% |
| U.S. Virgin Islanders | 0.0 /100 | #281 | Tragic 2.5% |
| Immigrants | Caribbean | 0.0 /100 | #282 | Tragic 2.5% |
| Puget Sound Salish | 0.0 /100 | #283 | Tragic 2.5% |
| Yakama | 0.0 /100 | #284 | Tragic 2.5% |
| Immigrants | Central America | 0.0 /100 | #285 | Tragic 2.5% |
| Sioux | 0.0 /100 | #286 | Tragic 2.5% |
| Hondurans | 0.0 /100 | #287 | Tragic 2.5% |
| French American Indians | 0.0 /100 | #288 | Tragic 2.5% |
| Immigrants | Nonimmigrants | 0.0 /100 | #289 | Tragic 2.5% |
| Immigrants | Cuba | 0.0 /100 | #290 | Tragic 2.5% |
| Immigrants | Honduras | 0.0 /100 | #291 | Tragic 2.5% |
| Crow | 0.0 /100 | #292 | Tragic 2.5% |
| Yaqui | 0.0 /100 | #293 | Tragic 2.5% |
Demographics Similar to Turks by Vision Disability
In terms of vision disability, the demographic groups most similar to Turks are Immigrants from Pakistan (1.9%, a difference of 0.050%), Asian (1.9%, a difference of 0.31%), Immigrants from Asia (1.9%, a difference of 0.59%), Immigrants from Lithuania (1.9%, a difference of 0.71%), and Bulgarian (1.9%, a difference of 0.75%).
| Demographics | Rating | Rank | Vision Disability |
| Immigrants | China | 100.0 /100 | #14 | Exceptional 1.8% |
| Immigrants | Bolivia | 100.0 /100 | #15 | Exceptional 1.8% |
| Indians (Asian) | 100.0 /100 | #16 | Exceptional 1.8% |
| Burmese | 100.0 /100 | #17 | Exceptional 1.8% |
| Bolivians | 100.0 /100 | #18 | Exceptional 1.9% |
| Immigrants | Sri Lanka | 100.0 /100 | #19 | Exceptional 1.9% |
| Asians | 100.0 /100 | #20 | Exceptional 1.9% |
| Turks | 100.0 /100 | #21 | Exceptional 1.9% |
| Immigrants | Pakistan | 100.0 /100 | #22 | Exceptional 1.9% |
| Immigrants | Asia | 99.9 /100 | #23 | Exceptional 1.9% |
| Immigrants | Lithuania | 99.9 /100 | #24 | Exceptional 1.9% |
| Bulgarians | 99.9 /100 | #25 | Exceptional 1.9% |
| Immigrants | Japan | 99.9 /100 | #26 | Exceptional 1.9% |
| Taiwanese | 99.9 /100 | #27 | Exceptional 1.9% |
| Immigrants | Malaysia | 99.9 /100 | #28 | Exceptional 1.9% |