Immigrants from Zaire vs Menominee Vision Disability
COMPARE
Immigrants from Zaire
Menominee
Vision Disability
Vision Disability Comparison
Immigrants from Zaire
Menominee
2.2%
VISION DISABILITY
18.0/ 100
METRIC RATING
202nd/ 347
METRIC RANK
2.5%
VISION DISABILITY
0.0/ 100
METRIC RATING
301st/ 347
METRIC RANK
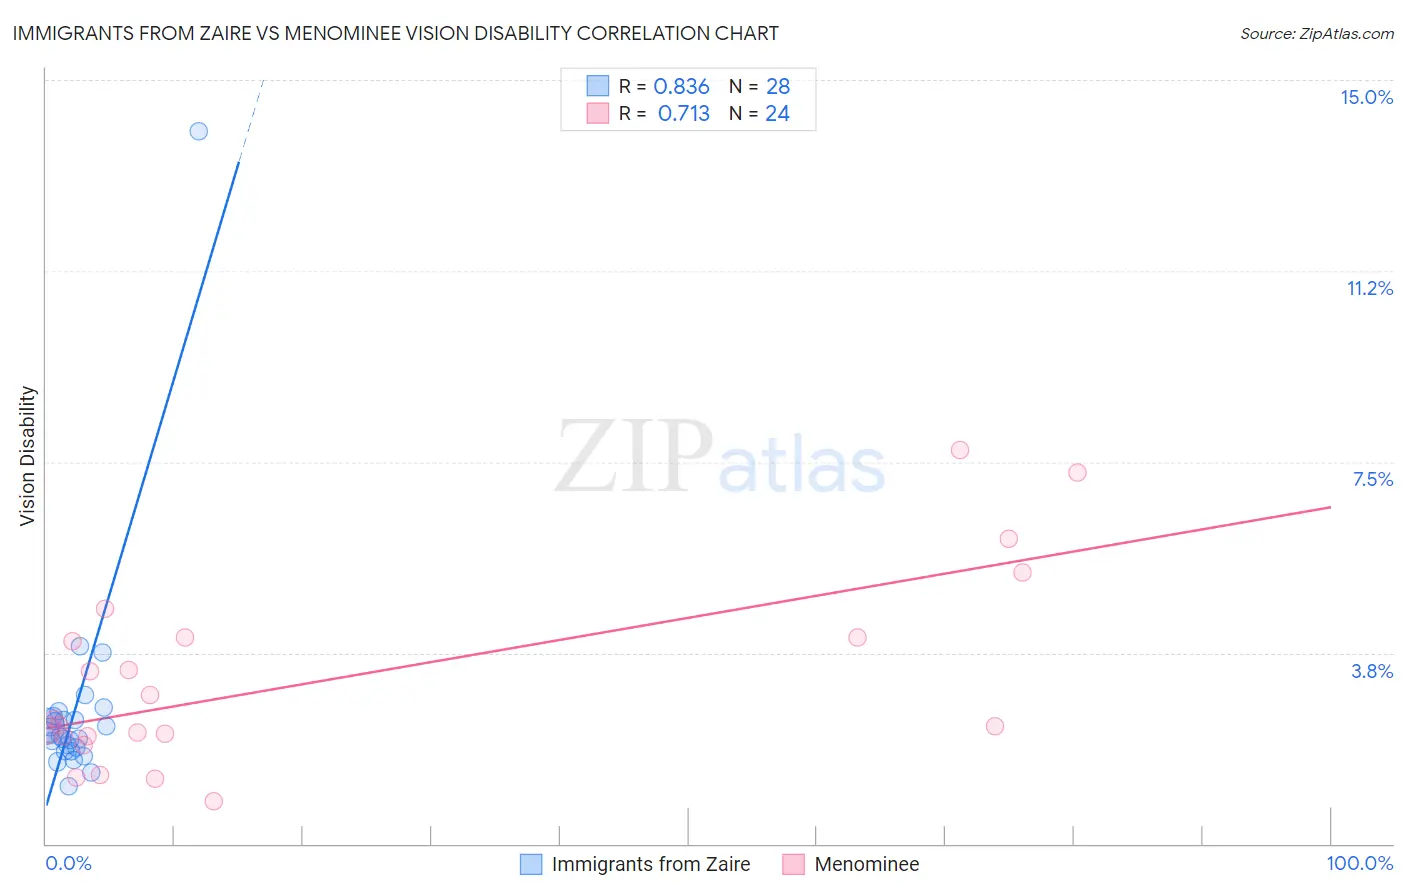
Immigrants from Zaire vs Menominee Vision Disability Correlation Chart
The statistical analysis conducted on geographies consisting of 107,249,797 people shows a very strong positive correlation between the proportion of Immigrants from Zaire and percentage of population with vision disability in the United States with a correlation coefficient (R) of 0.836 and weighted average of 2.2%. Similarly, the statistical analysis conducted on geographies consisting of 45,774,970 people shows a strong positive correlation between the proportion of Menominee and percentage of population with vision disability in the United States with a correlation coefficient (R) of 0.713 and weighted average of 2.5%, a difference of 14.7%.
Vision Disability Correlation Summary
| Measurement | Immigrants from Zaire | Menominee |
| Minimum | 1.1% | 0.83% |
| Maximum | 14.0% | 7.7% |
| Range | 12.9% | 6.9% |
| Mean | 2.6% | 3.2% |
| Median | 2.1% | 2.4% |
| Interquartile 25% (IQ1) | 1.9% | 2.1% |
| Interquartile 75% (IQ3) | 2.5% | 4.0% |
| Interquartile Range (IQR) | 0.61% | 1.9% |
| Standard Deviation (Sample) | 2.3% | 1.9% |
| Standard Deviation (Population) | 2.3% | 1.8% |
Similar Demographics by Vision Disability
Demographics Similar to Immigrants from Zaire by Vision Disability
In terms of vision disability, the demographic groups most similar to Immigrants from Zaire are Slovak (2.2%, a difference of 0.090%), Dutch (2.2%, a difference of 0.10%), Immigrants from Thailand (2.2%, a difference of 0.22%), Immigrants from Guyana (2.2%, a difference of 0.23%), and Samoan (2.2%, a difference of 0.25%).
| Demographics | Rating | Rank | Vision Disability |
| Immigrants | Immigrants | 23.7 /100 | #195 | Fair 2.2% |
| Immigrants | Grenada | 23.1 /100 | #196 | Fair 2.2% |
| Ghanaians | 21.8 /100 | #197 | Fair 2.2% |
| Czechoslovakians | 21.6 /100 | #198 | Fair 2.2% |
| Immigrants | El Salvador | 21.0 /100 | #199 | Fair 2.2% |
| Immigrants | Thailand | 20.1 /100 | #200 | Fair 2.2% |
| Slovaks | 18.8 /100 | #201 | Poor 2.2% |
| Immigrants | Zaire | 18.0 /100 | #202 | Poor 2.2% |
| Dutch | 17.1 /100 | #203 | Poor 2.2% |
| Immigrants | Guyana | 15.9 /100 | #204 | Poor 2.2% |
| Samoans | 15.7 /100 | #205 | Poor 2.2% |
| Pennsylvania Germans | 14.5 /100 | #206 | Poor 2.2% |
| Immigrants | Nigeria | 13.5 /100 | #207 | Poor 2.2% |
| Germans | 13.4 /100 | #208 | Poor 2.2% |
| Immigrants | Brazil | 13.1 /100 | #209 | Poor 2.2% |
Demographics Similar to Menominee by Vision Disability
In terms of vision disability, the demographic groups most similar to Menominee are African (2.5%, a difference of 0.18%), Cree (2.5%, a difference of 0.38%), Mexican (2.5%, a difference of 0.41%), Immigrants from Dominica (2.5%, a difference of 0.55%), and Immigrants from Mexico (2.5%, a difference of 1.2%).
| Demographics | Rating | Rank | Vision Disability |
| Ottawa | 0.0 /100 | #294 | Tragic 2.5% |
| Delaware | 0.0 /100 | #295 | Tragic 2.5% |
| Immigrants | Mexico | 0.0 /100 | #296 | Tragic 2.5% |
| Immigrants | Dominica | 0.0 /100 | #297 | Tragic 2.5% |
| Mexicans | 0.0 /100 | #298 | Tragic 2.5% |
| Cree | 0.0 /100 | #299 | Tragic 2.5% |
| Africans | 0.0 /100 | #300 | Tragic 2.5% |
| Menominee | 0.0 /100 | #301 | Tragic 2.5% |
| Spanish American Indians | 0.0 /100 | #302 | Tragic 2.6% |
| Immigrants | Cabo Verde | 0.0 /100 | #303 | Tragic 2.6% |
| Aleuts | 0.0 /100 | #304 | Tragic 2.6% |
| Hispanics or Latinos | 0.0 /100 | #305 | Tragic 2.6% |
| Iroquois | 0.0 /100 | #306 | Tragic 2.6% |
| Immigrants | Dominican Republic | 0.0 /100 | #307 | Tragic 2.6% |
| Arapaho | 0.0 /100 | #308 | Tragic 2.6% |