African vs Menominee Vision Disability
COMPARE
African
Menominee
Vision Disability
Vision Disability Comparison
Africans
Menominee
2.5%
VISION DISABILITY
0.0/ 100
METRIC RATING
300th/ 347
METRIC RANK
2.5%
VISION DISABILITY
0.0/ 100
METRIC RATING
301st/ 347
METRIC RANK
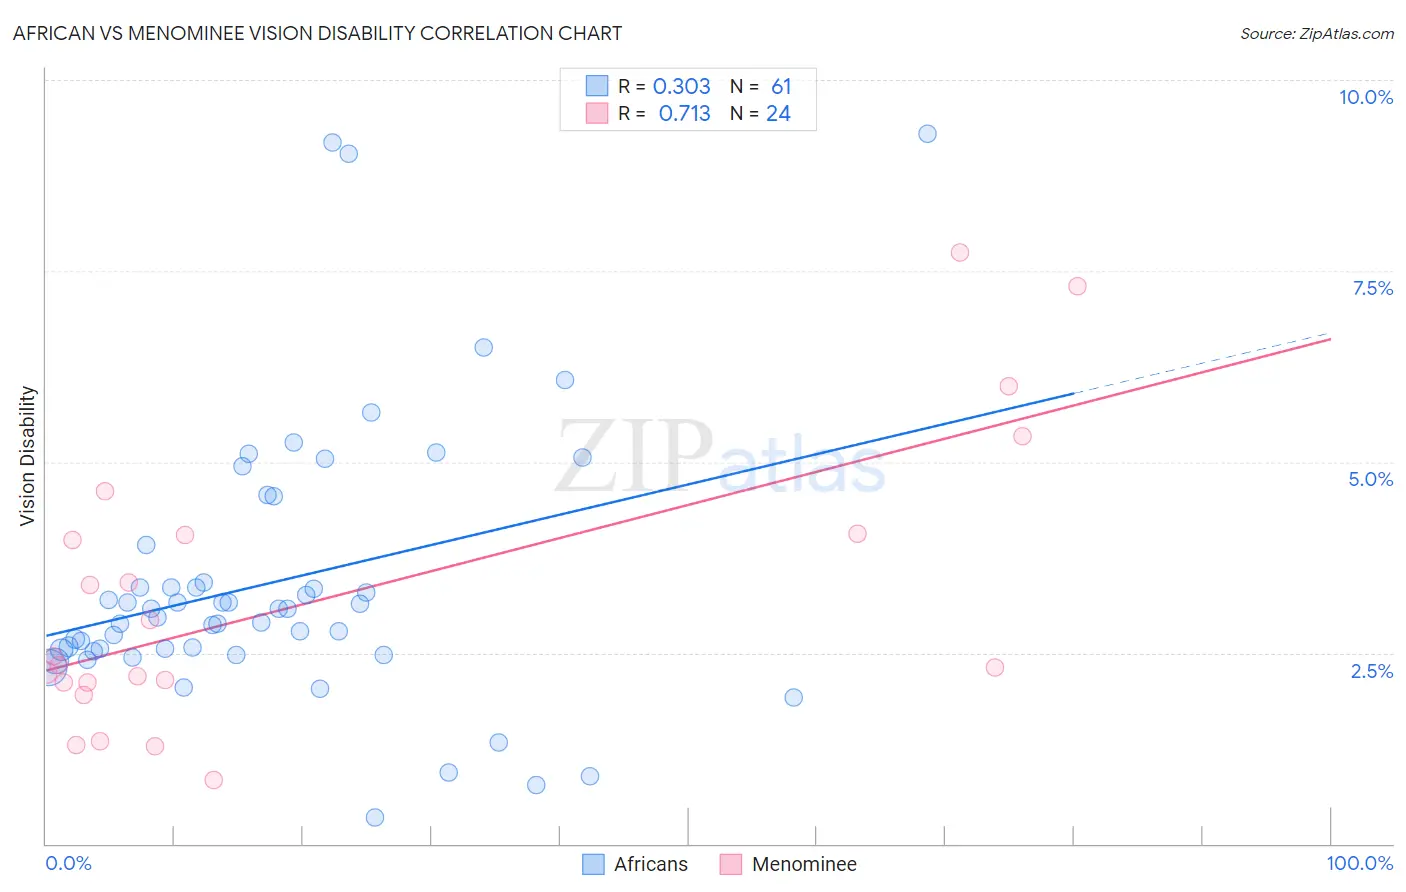
African vs Menominee Vision Disability Correlation Chart
The statistical analysis conducted on geographies consisting of 469,580,037 people shows a mild positive correlation between the proportion of Africans and percentage of population with vision disability in the United States with a correlation coefficient (R) of 0.303 and weighted average of 2.5%. Similarly, the statistical analysis conducted on geographies consisting of 45,774,970 people shows a strong positive correlation between the proportion of Menominee and percentage of population with vision disability in the United States with a correlation coefficient (R) of 0.713 and weighted average of 2.5%, a difference of 0.18%.
Vision Disability Correlation Summary
| Measurement | African | Menominee |
| Minimum | 0.34% | 0.83% |
| Maximum | 9.3% | 7.7% |
| Range | 9.0% | 6.9% |
| Mean | 3.4% | 3.2% |
| Median | 3.1% | 2.4% |
| Interquartile 25% (IQ1) | 2.5% | 2.1% |
| Interquartile 75% (IQ3) | 3.7% | 4.0% |
| Interquartile Range (IQR) | 1.1% | 1.9% |
| Standard Deviation (Sample) | 1.8% | 1.9% |
| Standard Deviation (Population) | 1.8% | 1.8% |
Demographics Similar to Africans and Menominee by Vision Disability
In terms of vision disability, the demographic groups most similar to Africans are Cree (2.5%, a difference of 0.20%), Mexican (2.5%, a difference of 0.24%), Immigrants from Dominica (2.5%, a difference of 0.37%), Immigrants from Mexico (2.5%, a difference of 1.1%), and Delaware (2.5%, a difference of 1.2%). Similarly, the demographic groups most similar to Menominee are Cree (2.5%, a difference of 0.38%), Mexican (2.5%, a difference of 0.41%), Immigrants from Dominica (2.5%, a difference of 0.55%), Immigrants from Mexico (2.5%, a difference of 1.2%), and Spanish American Indian (2.6%, a difference of 1.3%).
| Demographics | Rating | Rank | Vision Disability |
| Immigrants | Cuba | 0.0 /100 | #290 | Tragic 2.5% |
| Immigrants | Honduras | 0.0 /100 | #291 | Tragic 2.5% |
| Crow | 0.0 /100 | #292 | Tragic 2.5% |
| Yaqui | 0.0 /100 | #293 | Tragic 2.5% |
| Ottawa | 0.0 /100 | #294 | Tragic 2.5% |
| Delaware | 0.0 /100 | #295 | Tragic 2.5% |
| Immigrants | Mexico | 0.0 /100 | #296 | Tragic 2.5% |
| Immigrants | Dominica | 0.0 /100 | #297 | Tragic 2.5% |
| Mexicans | 0.0 /100 | #298 | Tragic 2.5% |
| Cree | 0.0 /100 | #299 | Tragic 2.5% |
| Africans | 0.0 /100 | #300 | Tragic 2.5% |
| Menominee | 0.0 /100 | #301 | Tragic 2.5% |
| Spanish American Indians | 0.0 /100 | #302 | Tragic 2.6% |
| Immigrants | Cabo Verde | 0.0 /100 | #303 | Tragic 2.6% |
| Aleuts | 0.0 /100 | #304 | Tragic 2.6% |
| Hispanics or Latinos | 0.0 /100 | #305 | Tragic 2.6% |
| Iroquois | 0.0 /100 | #306 | Tragic 2.6% |
| Immigrants | Dominican Republic | 0.0 /100 | #307 | Tragic 2.6% |
| Arapaho | 0.0 /100 | #308 | Tragic 2.6% |
| Immigrants | Yemen | 0.0 /100 | #309 | Tragic 2.6% |
| Blackfeet | 0.0 /100 | #310 | Tragic 2.6% |