Sioux vs Eastern European Vision Disability
COMPARE
Sioux
Eastern European
Vision Disability
Vision Disability Comparison
Sioux
Eastern Europeans
2.5%
VISION DISABILITY
0.0/ 100
METRIC RATING
286th/ 347
METRIC RANK
2.0%
VISION DISABILITY
99.7/ 100
METRIC RATING
43rd/ 347
METRIC RANK
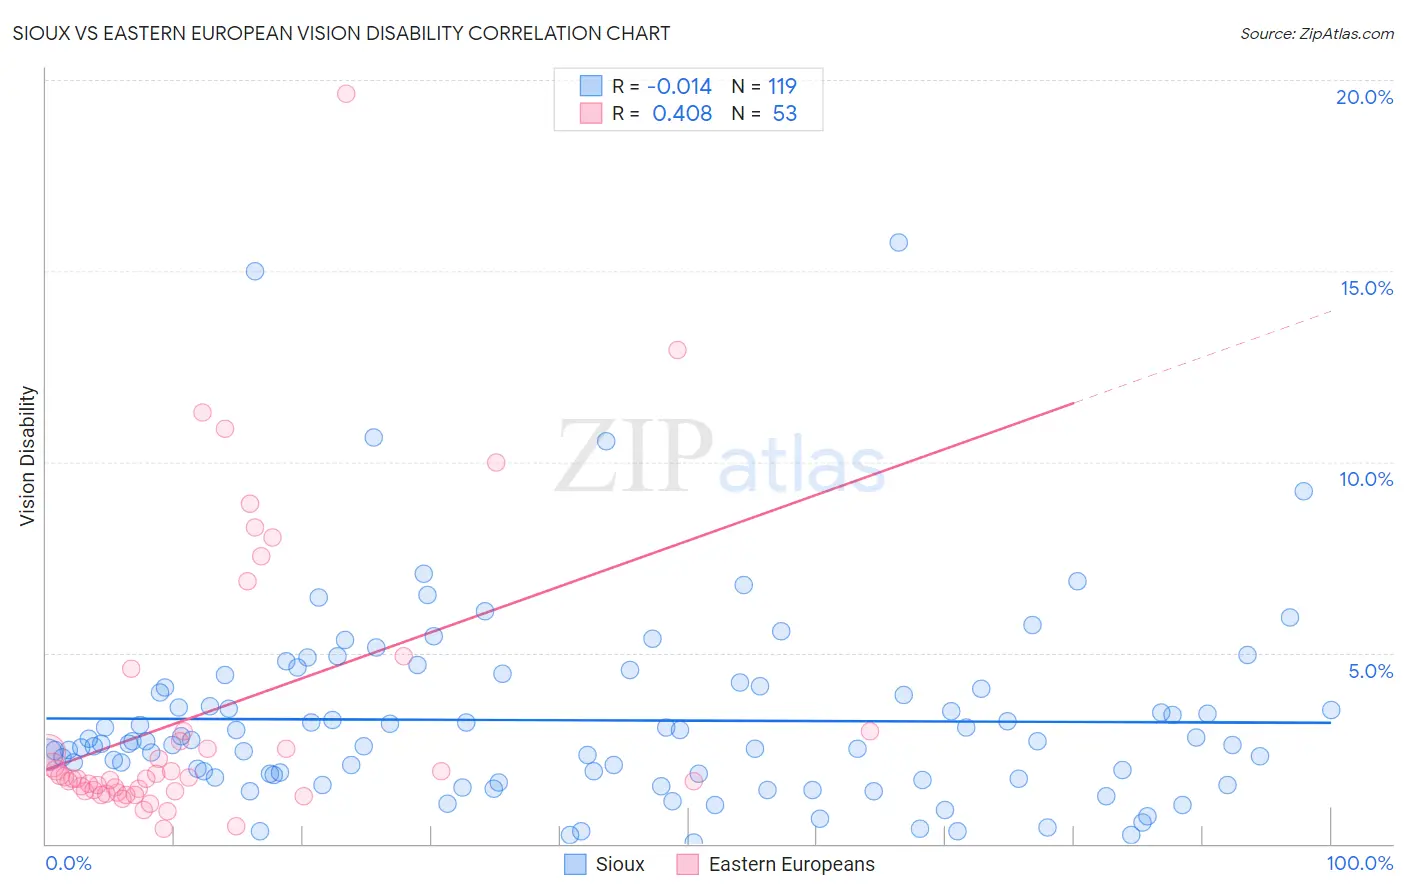
Sioux vs Eastern European Vision Disability Correlation Chart
The statistical analysis conducted on geographies consisting of 234,049,152 people shows no correlation between the proportion of Sioux and percentage of population with vision disability in the United States with a correlation coefficient (R) of -0.014 and weighted average of 2.5%. Similarly, the statistical analysis conducted on geographies consisting of 460,582,100 people shows a moderate positive correlation between the proportion of Eastern Europeans and percentage of population with vision disability in the United States with a correlation coefficient (R) of 0.408 and weighted average of 2.0%, a difference of 25.1%.
Vision Disability Correlation Summary
| Measurement | Sioux | Eastern European |
| Minimum | 0.034% | 0.38% |
| Maximum | 15.7% | 19.6% |
| Range | 15.7% | 19.2% |
| Mean | 3.2% | 3.4% |
| Median | 2.6% | 1.7% |
| Interquartile 25% (IQ1) | 1.7% | 1.4% |
| Interquartile 75% (IQ3) | 4.1% | 3.0% |
| Interquartile Range (IQR) | 2.3% | 1.6% |
| Standard Deviation (Sample) | 2.5% | 3.8% |
| Standard Deviation (Population) | 2.5% | 3.8% |
Similar Demographics by Vision Disability
Demographics Similar to Sioux by Vision Disability
In terms of vision disability, the demographic groups most similar to Sioux are Immigrants from Central America (2.5%, a difference of 0.010%), Yakama (2.5%, a difference of 0.030%), Honduran (2.5%, a difference of 0.14%), French American Indian (2.5%, a difference of 0.17%), and Puget Sound Salish (2.5%, a difference of 0.31%).
| Demographics | Rating | Rank | Vision Disability |
| Nepalese | 0.0 /100 | #279 | Tragic 2.4% |
| Cape Verdeans | 0.0 /100 | #280 | Tragic 2.4% |
| U.S. Virgin Islanders | 0.0 /100 | #281 | Tragic 2.5% |
| Immigrants | Caribbean | 0.0 /100 | #282 | Tragic 2.5% |
| Puget Sound Salish | 0.0 /100 | #283 | Tragic 2.5% |
| Yakama | 0.0 /100 | #284 | Tragic 2.5% |
| Immigrants | Central America | 0.0 /100 | #285 | Tragic 2.5% |
| Sioux | 0.0 /100 | #286 | Tragic 2.5% |
| Hondurans | 0.0 /100 | #287 | Tragic 2.5% |
| French American Indians | 0.0 /100 | #288 | Tragic 2.5% |
| Immigrants | Nonimmigrants | 0.0 /100 | #289 | Tragic 2.5% |
| Immigrants | Cuba | 0.0 /100 | #290 | Tragic 2.5% |
| Immigrants | Honduras | 0.0 /100 | #291 | Tragic 2.5% |
| Crow | 0.0 /100 | #292 | Tragic 2.5% |
| Yaqui | 0.0 /100 | #293 | Tragic 2.5% |
Demographics Similar to Eastern Europeans by Vision Disability
In terms of vision disability, the demographic groups most similar to Eastern Europeans are Immigrants from Indonesia (2.0%, a difference of 0.020%), Ethiopian (2.0%, a difference of 0.050%), Immigrants from Ethiopia (2.0%, a difference of 0.060%), Immigrants from Sweden (2.0%, a difference of 0.090%), and Immigrants from Bulgaria (2.0%, a difference of 0.11%).
| Demographics | Rating | Rank | Vision Disability |
| Cambodians | 99.8 /100 | #36 | Exceptional 2.0% |
| Bhutanese | 99.8 /100 | #37 | Exceptional 2.0% |
| Immigrants | Kuwait | 99.8 /100 | #38 | Exceptional 2.0% |
| Zimbabweans | 99.7 /100 | #39 | Exceptional 2.0% |
| Immigrants | Ireland | 99.7 /100 | #40 | Exceptional 2.0% |
| Cypriots | 99.7 /100 | #41 | Exceptional 2.0% |
| Immigrants | Ethiopia | 99.7 /100 | #42 | Exceptional 2.0% |
| Eastern Europeans | 99.7 /100 | #43 | Exceptional 2.0% |
| Immigrants | Indonesia | 99.7 /100 | #44 | Exceptional 2.0% |
| Ethiopians | 99.7 /100 | #45 | Exceptional 2.0% |
| Immigrants | Sweden | 99.7 /100 | #46 | Exceptional 2.0% |
| Immigrants | Bulgaria | 99.7 /100 | #47 | Exceptional 2.0% |
| Israelis | 99.6 /100 | #48 | Exceptional 2.0% |
| Latvians | 99.5 /100 | #49 | Exceptional 2.0% |
| Afghans | 99.5 /100 | #50 | Exceptional 2.0% |