Immigrants from Trinidad and Tobago vs Menominee Vision Disability
COMPARE
Immigrants from Trinidad and Tobago
Menominee
Vision Disability
Vision Disability Comparison
Immigrants from Trinidad and Tobago
Menominee
2.3%
VISION DISABILITY
6.1/ 100
METRIC RATING
216th/ 347
METRIC RANK
2.5%
VISION DISABILITY
0.0/ 100
METRIC RATING
301st/ 347
METRIC RANK
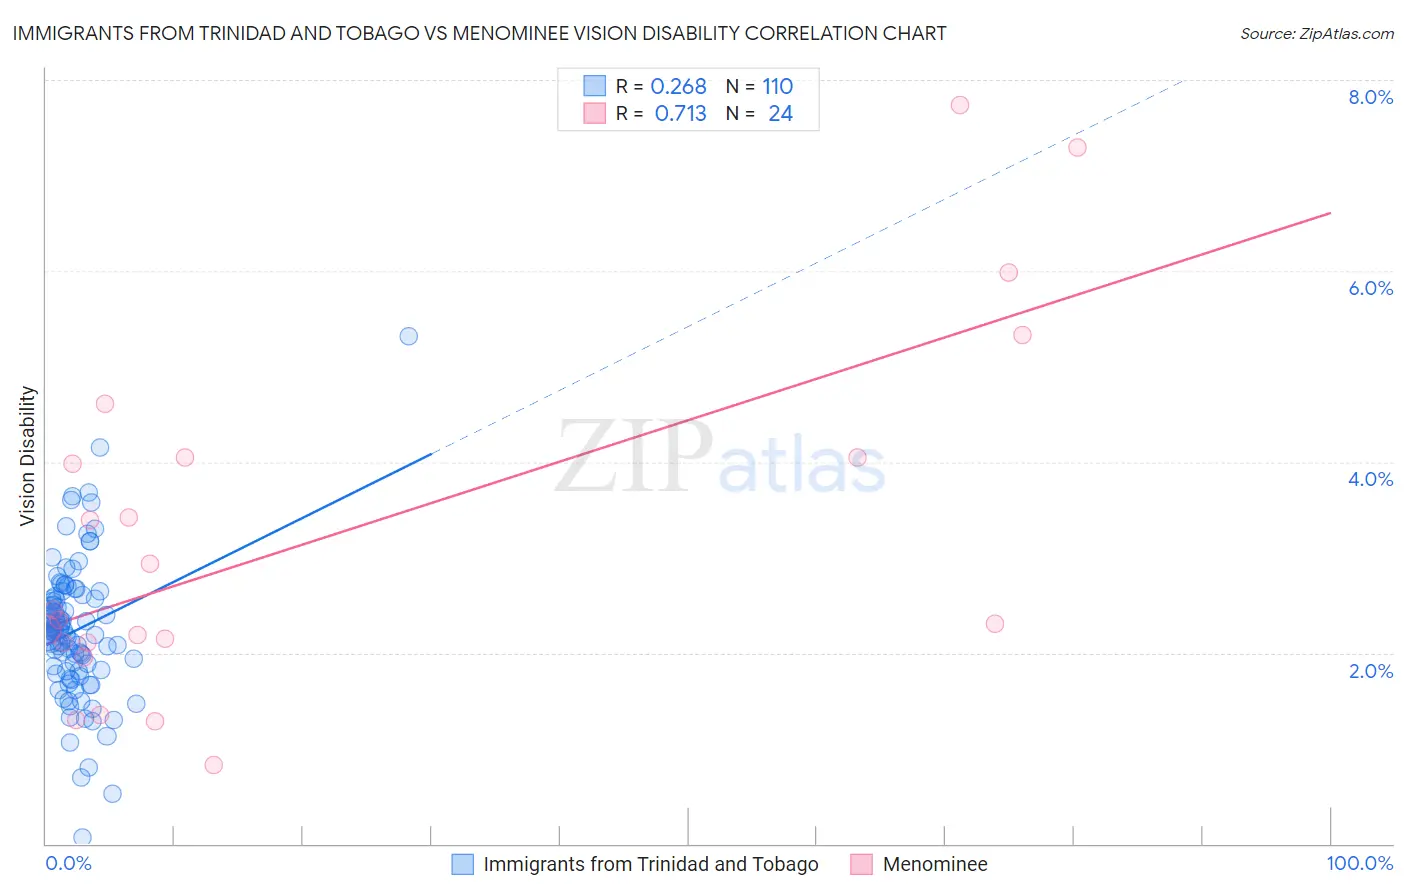
Immigrants from Trinidad and Tobago vs Menominee Vision Disability Correlation Chart
The statistical analysis conducted on geographies consisting of 223,458,050 people shows a weak positive correlation between the proportion of Immigrants from Trinidad and Tobago and percentage of population with vision disability in the United States with a correlation coefficient (R) of 0.268 and weighted average of 2.3%. Similarly, the statistical analysis conducted on geographies consisting of 45,774,970 people shows a strong positive correlation between the proportion of Menominee and percentage of population with vision disability in the United States with a correlation coefficient (R) of 0.713 and weighted average of 2.5%, a difference of 12.6%.
Vision Disability Correlation Summary
| Measurement | Immigrants from Trinidad and Tobago | Menominee |
| Minimum | 0.061% | 0.83% |
| Maximum | 5.3% | 7.7% |
| Range | 5.3% | 6.9% |
| Mean | 2.2% | 3.2% |
| Median | 2.2% | 2.4% |
| Interquartile 25% (IQ1) | 1.8% | 2.1% |
| Interquartile 75% (IQ3) | 2.6% | 4.0% |
| Interquartile Range (IQR) | 0.74% | 1.9% |
| Standard Deviation (Sample) | 0.72% | 1.9% |
| Standard Deviation (Population) | 0.72% | 1.8% |
Similar Demographics by Vision Disability
Demographics Similar to Immigrants from Trinidad and Tobago by Vision Disability
In terms of vision disability, the demographic groups most similar to Immigrants from Trinidad and Tobago are Barbadian (2.3%, a difference of 0.28%), Nigerian (2.3%, a difference of 0.29%), Portuguese (2.3%, a difference of 0.34%), Ecuadorian (2.3%, a difference of 0.45%), and Trinidadian and Tobagonian (2.2%, a difference of 0.50%).
| Demographics | Rating | Rank | Vision Disability |
| Immigrants | Brazil | 13.1 /100 | #209 | Poor 2.2% |
| Immigrants | Uruguay | 11.5 /100 | #210 | Poor 2.2% |
| Indonesians | 9.5 /100 | #211 | Tragic 2.2% |
| Bermudans | 9.0 /100 | #212 | Tragic 2.2% |
| Immigrants | Ghana | 8.9 /100 | #213 | Tragic 2.2% |
| Trinidadians and Tobagonians | 8.2 /100 | #214 | Tragic 2.2% |
| Nigerians | 7.2 /100 | #215 | Tragic 2.3% |
| Immigrants | Trinidad and Tobago | 6.1 /100 | #216 | Tragic 2.3% |
| Barbadians | 5.1 /100 | #217 | Tragic 2.3% |
| Portuguese | 4.9 /100 | #218 | Tragic 2.3% |
| Ecuadorians | 4.6 /100 | #219 | Tragic 2.3% |
| Guamanians/Chamorros | 3.9 /100 | #220 | Tragic 2.3% |
| French Canadians | 3.9 /100 | #221 | Tragic 2.3% |
| Immigrants | Senegal | 3.8 /100 | #222 | Tragic 2.3% |
| Basques | 3.5 /100 | #223 | Tragic 2.3% |
Demographics Similar to Menominee by Vision Disability
In terms of vision disability, the demographic groups most similar to Menominee are African (2.5%, a difference of 0.18%), Cree (2.5%, a difference of 0.38%), Mexican (2.5%, a difference of 0.41%), Immigrants from Dominica (2.5%, a difference of 0.55%), and Immigrants from Mexico (2.5%, a difference of 1.2%).
| Demographics | Rating | Rank | Vision Disability |
| Ottawa | 0.0 /100 | #294 | Tragic 2.5% |
| Delaware | 0.0 /100 | #295 | Tragic 2.5% |
| Immigrants | Mexico | 0.0 /100 | #296 | Tragic 2.5% |
| Immigrants | Dominica | 0.0 /100 | #297 | Tragic 2.5% |
| Mexicans | 0.0 /100 | #298 | Tragic 2.5% |
| Cree | 0.0 /100 | #299 | Tragic 2.5% |
| Africans | 0.0 /100 | #300 | Tragic 2.5% |
| Menominee | 0.0 /100 | #301 | Tragic 2.5% |
| Spanish American Indians | 0.0 /100 | #302 | Tragic 2.6% |
| Immigrants | Cabo Verde | 0.0 /100 | #303 | Tragic 2.6% |
| Aleuts | 0.0 /100 | #304 | Tragic 2.6% |
| Hispanics or Latinos | 0.0 /100 | #305 | Tragic 2.6% |
| Iroquois | 0.0 /100 | #306 | Tragic 2.6% |
| Immigrants | Dominican Republic | 0.0 /100 | #307 | Tragic 2.6% |
| Arapaho | 0.0 /100 | #308 | Tragic 2.6% |