Sioux vs Immigrants from Ukraine Disability Age Under 5
COMPARE
Sioux
Immigrants from Ukraine
Disability Age Under 5
Disability Age Under 5 Comparison
Sioux
Immigrants from Ukraine
1.8%
DISABILITY AGE UNDER 5
0.0/ 100
METRIC RATING
326th/ 347
METRIC RANK
1.0%
DISABILITY AGE UNDER 5
99.9/ 100
METRIC RATING
34th/ 347
METRIC RANK
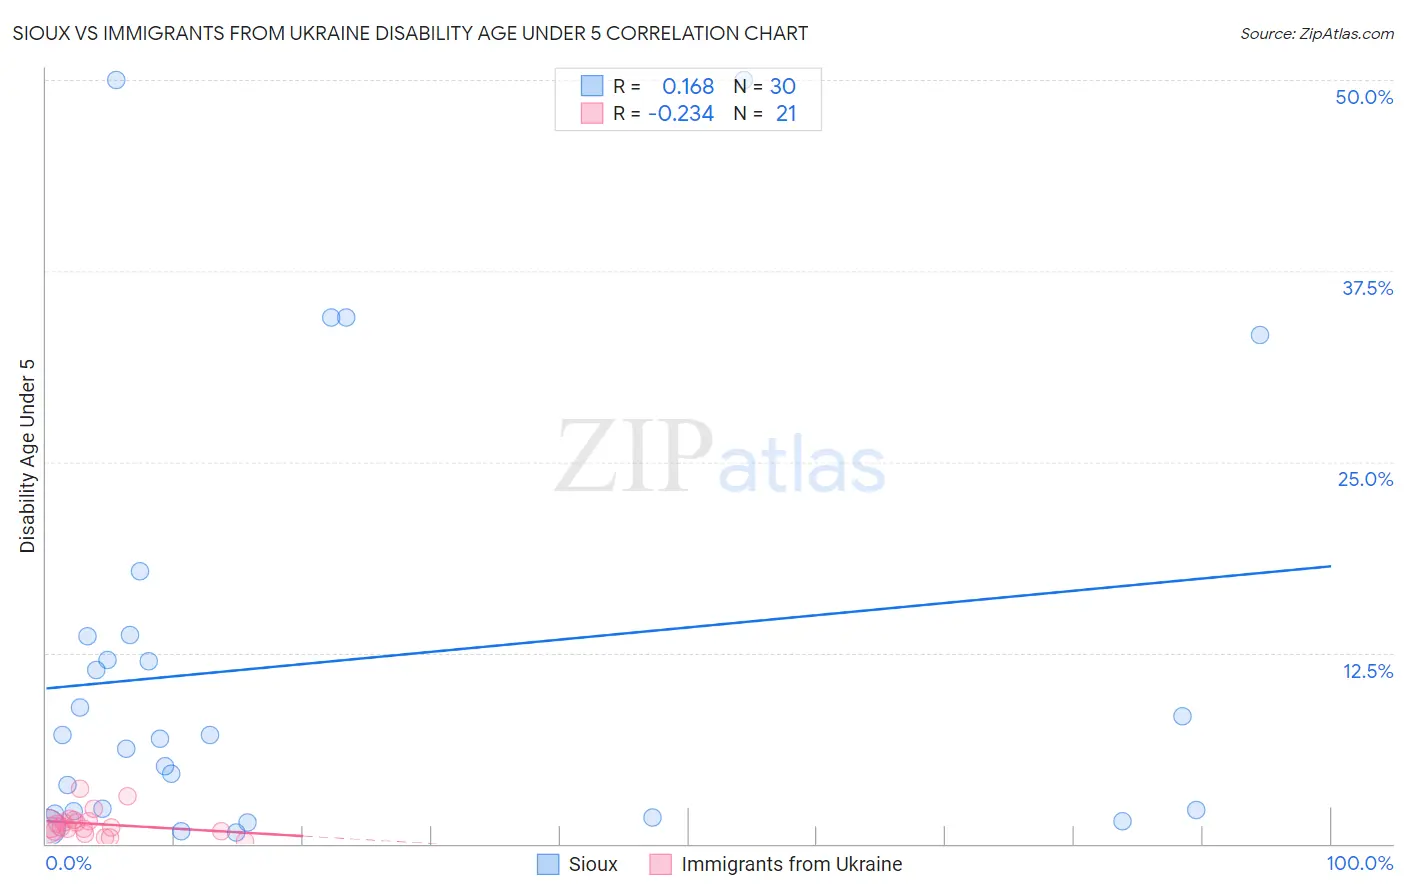
Sioux vs Immigrants from Ukraine Disability Age Under 5 Correlation Chart
The statistical analysis conducted on geographies consisting of 151,129,395 people shows a poor positive correlation between the proportion of Sioux and percentage of population with a disability under the age of 5 in the United States with a correlation coefficient (R) of 0.168 and weighted average of 1.8%. Similarly, the statistical analysis conducted on geographies consisting of 168,851,618 people shows a weak negative correlation between the proportion of Immigrants from Ukraine and percentage of population with a disability under the age of 5 in the United States with a correlation coefficient (R) of -0.234 and weighted average of 1.0%, a difference of 76.0%.
Disability Age Under 5 Correlation Summary
| Measurement | Sioux | Immigrants from Ukraine |
| Minimum | 0.72% | 0.14% |
| Maximum | 50.0% | 3.6% |
| Range | 49.3% | 3.5% |
| Mean | 11.9% | 1.3% |
| Median | 7.0% | 1.1% |
| Interquartile 25% (IQ1) | 2.1% | 0.82% |
| Interquartile 75% (IQ3) | 13.6% | 1.5% |
| Interquartile Range (IQR) | 11.5% | 0.70% |
| Standard Deviation (Sample) | 14.1% | 0.83% |
| Standard Deviation (Population) | 13.9% | 0.81% |
Similar Demographics by Disability Age Under 5
Demographics Similar to Sioux by Disability Age Under 5
In terms of disability age under 5, the demographic groups most similar to Sioux are Osage (1.8%, a difference of 0.39%), Immigrants from Portugal (1.8%, a difference of 1.4%), American (1.9%, a difference of 2.1%), Houma (1.9%, a difference of 2.6%), and Cherokee (1.8%, a difference of 2.8%).
| Demographics | Rating | Rank | Disability Age Under 5 |
| Slovaks | 0.0 /100 | #319 | Tragic 1.7% |
| Scotch-Irish | 0.0 /100 | #320 | Tragic 1.7% |
| Ottawa | 0.0 /100 | #321 | Tragic 1.7% |
| Germans | 0.0 /100 | #322 | Tragic 1.7% |
| Chickasaw | 0.0 /100 | #323 | Tragic 1.7% |
| Cherokee | 0.0 /100 | #324 | Tragic 1.8% |
| Immigrants | Portugal | 0.0 /100 | #325 | Tragic 1.8% |
| Sioux | 0.0 /100 | #326 | Tragic 1.8% |
| Osage | 0.0 /100 | #327 | Tragic 1.8% |
| Americans | 0.0 /100 | #328 | Tragic 1.9% |
| Houma | 0.0 /100 | #329 | Tragic 1.9% |
| Choctaw | 0.0 /100 | #330 | Tragic 1.9% |
| French Canadians | 0.0 /100 | #331 | Tragic 1.9% |
| Chippewa | 0.0 /100 | #332 | Tragic 1.9% |
| Dutch West Indians | 0.0 /100 | #333 | Tragic 1.9% |
Demographics Similar to Immigrants from Ukraine by Disability Age Under 5
In terms of disability age under 5, the demographic groups most similar to Immigrants from Ukraine are Bolivian (1.0%, a difference of 0.12%), Barbadian (1.0%, a difference of 0.24%), Iranian (1.0%, a difference of 0.29%), Armenian (1.0%, a difference of 0.34%), and Immigrants from South Central Asia (1.0%, a difference of 0.63%).
| Demographics | Rating | Rank | Disability Age Under 5 |
| Guyanese | 100.0 /100 | #27 | Exceptional 1.0% |
| Immigrants | Eastern Asia | 100.0 /100 | #28 | Exceptional 1.0% |
| Immigrants | Belarus | 100.0 /100 | #29 | Exceptional 1.0% |
| Immigrants | South Central Asia | 99.9 /100 | #30 | Exceptional 1.0% |
| Armenians | 99.9 /100 | #31 | Exceptional 1.0% |
| Iranians | 99.9 /100 | #32 | Exceptional 1.0% |
| Bolivians | 99.9 /100 | #33 | Exceptional 1.0% |
| Immigrants | Ukraine | 99.9 /100 | #34 | Exceptional 1.0% |
| Barbadians | 99.9 /100 | #35 | Exceptional 1.0% |
| Immigrants | Nepal | 99.9 /100 | #36 | Exceptional 1.0% |
| Immigrants | India | 99.9 /100 | #37 | Exceptional 1.0% |
| Immigrants | Guyana | 99.9 /100 | #38 | Exceptional 1.0% |
| Filipinos | 99.9 /100 | #39 | Exceptional 1.1% |
| Immigrants | Albania | 99.9 /100 | #40 | Exceptional 1.1% |
| Thais | 99.8 /100 | #41 | Exceptional 1.1% |