Immigrants from Singapore vs Immigrants from Ukraine Disability Age Under 5
COMPARE
Immigrants from Singapore
Immigrants from Ukraine
Disability Age Under 5
Disability Age Under 5 Comparison
Immigrants from Singapore
Immigrants from Ukraine
1.1%
DISABILITY AGE UNDER 5
99.7/ 100
METRIC RATING
48th/ 347
METRIC RANK
1.0%
DISABILITY AGE UNDER 5
99.9/ 100
METRIC RATING
34th/ 347
METRIC RANK
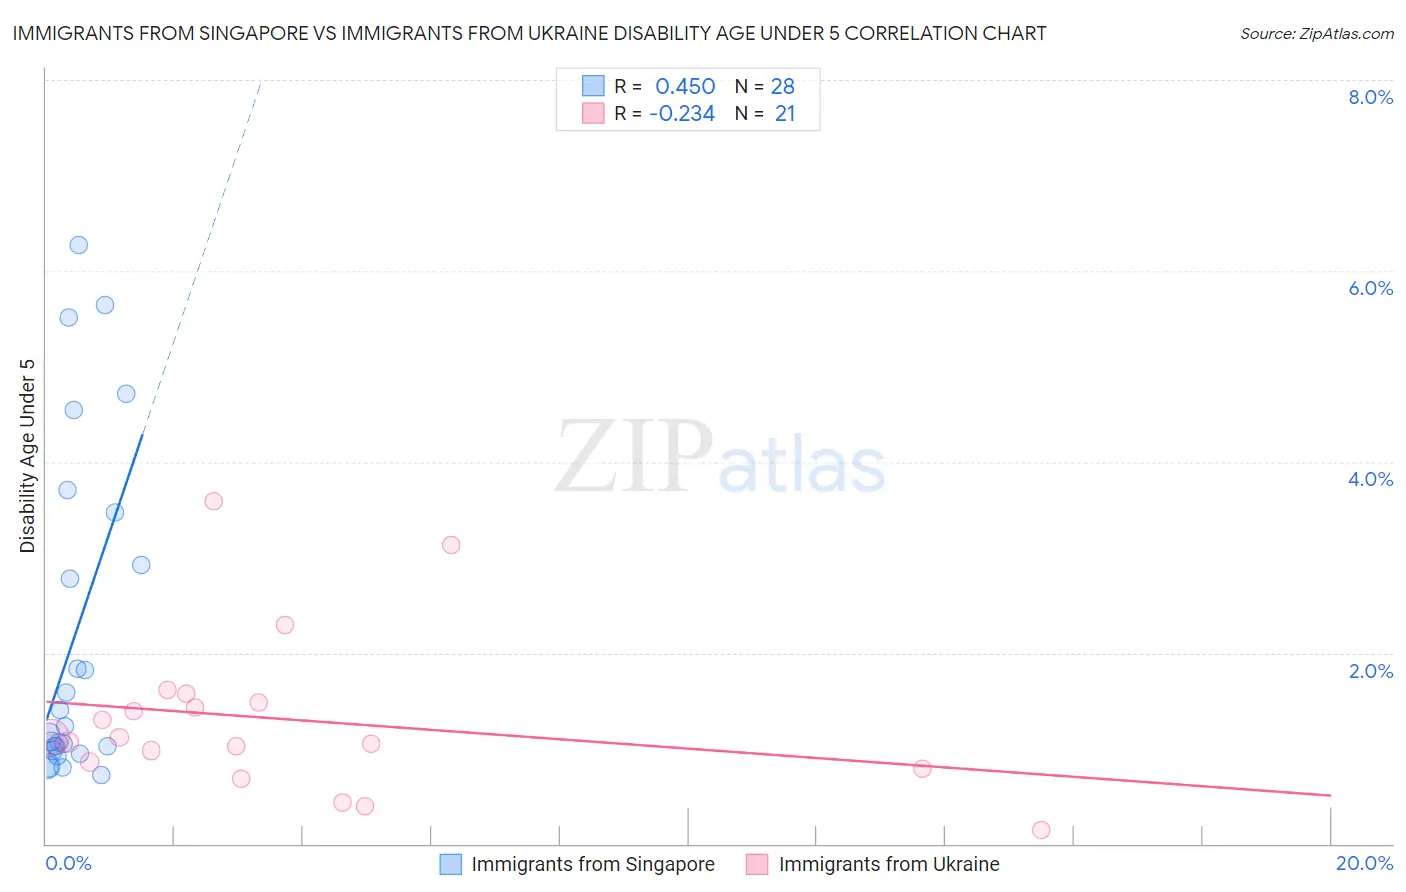
Immigrants from Singapore vs Immigrants from Ukraine Disability Age Under 5 Correlation Chart
The statistical analysis conducted on geographies consisting of 97,565,040 people shows a moderate positive correlation between the proportion of Immigrants from Singapore and percentage of population with a disability under the age of 5 in the United States with a correlation coefficient (R) of 0.450 and weighted average of 1.1%. Similarly, the statistical analysis conducted on geographies consisting of 168,851,618 people shows a weak negative correlation between the proportion of Immigrants from Ukraine and percentage of population with a disability under the age of 5 in the United States with a correlation coefficient (R) of -0.234 and weighted average of 1.0%, a difference of 3.7%.
Disability Age Under 5 Correlation Summary
| Measurement | Immigrants from Singapore | Immigrants from Ukraine |
| Minimum | 0.71% | 0.14% |
| Maximum | 6.3% | 3.6% |
| Range | 5.6% | 3.5% |
| Mean | 2.2% | 1.3% |
| Median | 1.2% | 1.1% |
| Interquartile 25% (IQ1) | 1.00% | 0.82% |
| Interquartile 75% (IQ3) | 3.2% | 1.5% |
| Interquartile Range (IQR) | 2.2% | 0.70% |
| Standard Deviation (Sample) | 1.7% | 0.83% |
| Standard Deviation (Population) | 1.7% | 0.81% |
Demographics Similar to Immigrants from Singapore and Immigrants from Ukraine by Disability Age Under 5
In terms of disability age under 5, the demographic groups most similar to Immigrants from Singapore are Immigrants from Russia (1.1%, a difference of 0.21%), Immigrants from Sweden (1.1%, a difference of 0.22%), Immigrants from Japan (1.1%, a difference of 0.22%), Immigrants from Congo (1.1%, a difference of 0.36%), and Immigrants from Kazakhstan (1.1%, a difference of 0.41%). Similarly, the demographic groups most similar to Immigrants from Ukraine are Bolivian (1.0%, a difference of 0.12%), Barbadian (1.0%, a difference of 0.24%), Iranian (1.0%, a difference of 0.29%), Armenian (1.0%, a difference of 0.34%), and Immigrants from Nepal (1.0%, a difference of 0.95%).
| Demographics | Rating | Rank | Disability Age Under 5 |
| Armenians | 99.9 /100 | #31 | Exceptional 1.0% |
| Iranians | 99.9 /100 | #32 | Exceptional 1.0% |
| Bolivians | 99.9 /100 | #33 | Exceptional 1.0% |
| Immigrants | Ukraine | 99.9 /100 | #34 | Exceptional 1.0% |
| Barbadians | 99.9 /100 | #35 | Exceptional 1.0% |
| Immigrants | Nepal | 99.9 /100 | #36 | Exceptional 1.0% |
| Immigrants | India | 99.9 /100 | #37 | Exceptional 1.0% |
| Immigrants | Guyana | 99.9 /100 | #38 | Exceptional 1.0% |
| Filipinos | 99.9 /100 | #39 | Exceptional 1.1% |
| Immigrants | Albania | 99.9 /100 | #40 | Exceptional 1.1% |
| Thais | 99.8 /100 | #41 | Exceptional 1.1% |
| Immigrants | Bulgaria | 99.8 /100 | #42 | Exceptional 1.1% |
| Pima | 99.8 /100 | #43 | Exceptional 1.1% |
| Immigrants | Asia | 99.8 /100 | #44 | Exceptional 1.1% |
| Immigrants | Turkey | 99.8 /100 | #45 | Exceptional 1.1% |
| Immigrants | Congo | 99.8 /100 | #46 | Exceptional 1.1% |
| Immigrants | Sweden | 99.8 /100 | #47 | Exceptional 1.1% |
| Immigrants | Singapore | 99.7 /100 | #48 | Exceptional 1.1% |
| Immigrants | Russia | 99.7 /100 | #49 | Exceptional 1.1% |
| Immigrants | Japan | 99.7 /100 | #50 | Exceptional 1.1% |
| Immigrants | Kazakhstan | 99.7 /100 | #51 | Exceptional 1.1% |