Sioux vs Immigrants from Japan Disability Age Under 5
COMPARE
Sioux
Immigrants from Japan
Disability Age Under 5
Disability Age Under 5 Comparison
Sioux
Immigrants from Japan
1.8%
DISABILITY AGE UNDER 5
0.0/ 100
METRIC RATING
326th/ 347
METRIC RANK
1.1%
DISABILITY AGE UNDER 5
99.7/ 100
METRIC RATING
50th/ 347
METRIC RANK
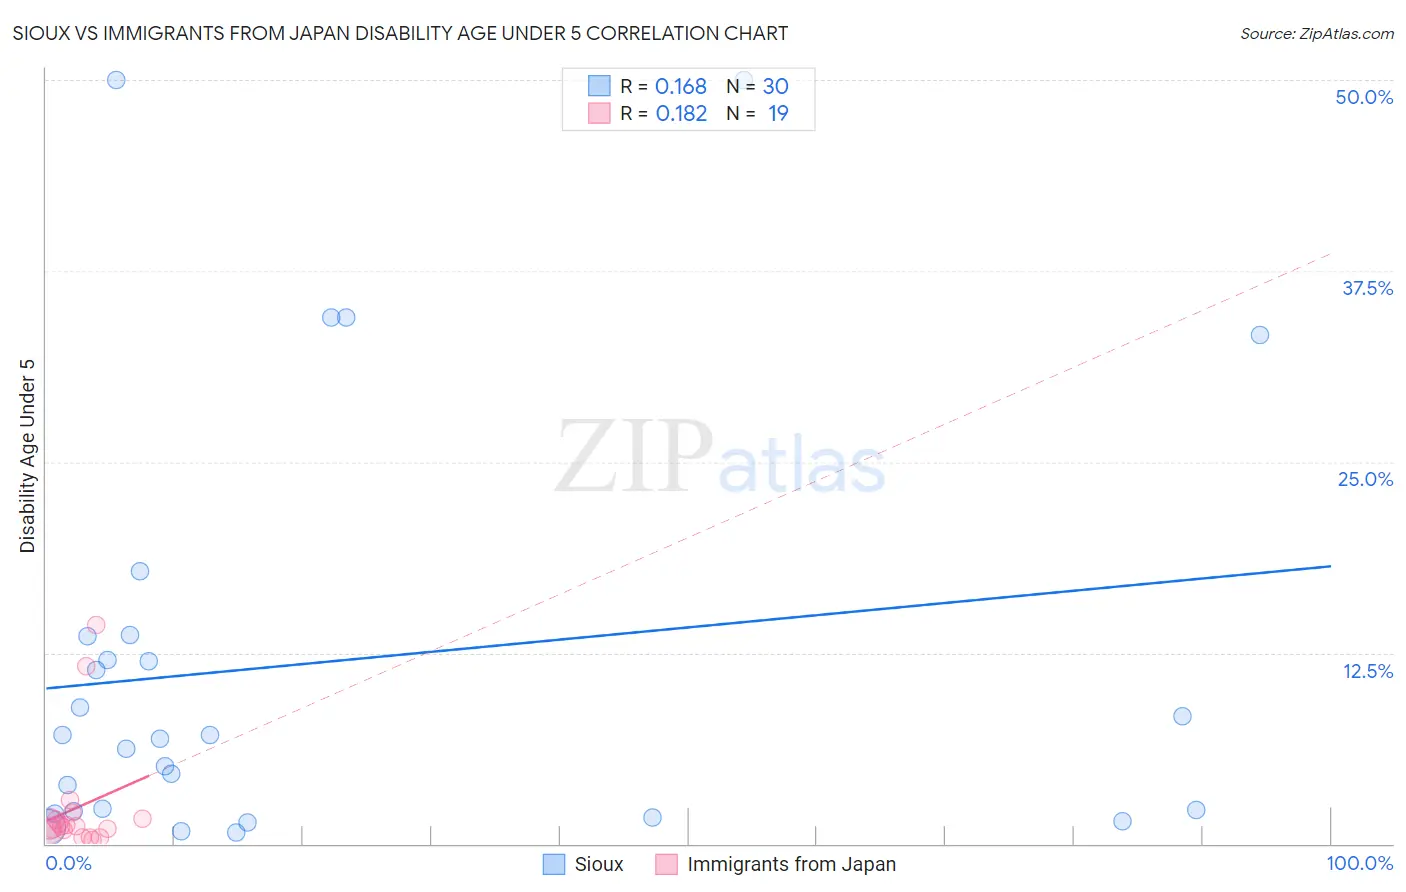
Sioux vs Immigrants from Japan Disability Age Under 5 Correlation Chart
The statistical analysis conducted on geographies consisting of 151,129,395 people shows a poor positive correlation between the proportion of Sioux and percentage of population with a disability under the age of 5 in the United States with a correlation coefficient (R) of 0.168 and weighted average of 1.8%. Similarly, the statistical analysis conducted on geographies consisting of 195,570,677 people shows a poor positive correlation between the proportion of Immigrants from Japan and percentage of population with a disability under the age of 5 in the United States with a correlation coefficient (R) of 0.182 and weighted average of 1.1%, a difference of 69.3%.
Disability Age Under 5 Correlation Summary
| Measurement | Sioux | Immigrants from Japan |
| Minimum | 0.72% | 0.28% |
| Maximum | 50.0% | 14.3% |
| Range | 49.3% | 14.0% |
| Mean | 11.9% | 2.4% |
| Median | 7.0% | 1.1% |
| Interquartile 25% (IQ1) | 2.1% | 0.88% |
| Interquartile 75% (IQ3) | 13.6% | 1.7% |
| Interquartile Range (IQR) | 11.5% | 0.79% |
| Standard Deviation (Sample) | 14.1% | 3.8% |
| Standard Deviation (Population) | 13.9% | 3.7% |
Similar Demographics by Disability Age Under 5
Demographics Similar to Sioux by Disability Age Under 5
In terms of disability age under 5, the demographic groups most similar to Sioux are Osage (1.8%, a difference of 0.39%), Immigrants from Portugal (1.8%, a difference of 1.4%), American (1.9%, a difference of 2.1%), Houma (1.9%, a difference of 2.6%), and Cherokee (1.8%, a difference of 2.8%).
| Demographics | Rating | Rank | Disability Age Under 5 |
| Slovaks | 0.0 /100 | #319 | Tragic 1.7% |
| Scotch-Irish | 0.0 /100 | #320 | Tragic 1.7% |
| Ottawa | 0.0 /100 | #321 | Tragic 1.7% |
| Germans | 0.0 /100 | #322 | Tragic 1.7% |
| Chickasaw | 0.0 /100 | #323 | Tragic 1.7% |
| Cherokee | 0.0 /100 | #324 | Tragic 1.8% |
| Immigrants | Portugal | 0.0 /100 | #325 | Tragic 1.8% |
| Sioux | 0.0 /100 | #326 | Tragic 1.8% |
| Osage | 0.0 /100 | #327 | Tragic 1.8% |
| Americans | 0.0 /100 | #328 | Tragic 1.9% |
| Houma | 0.0 /100 | #329 | Tragic 1.9% |
| Choctaw | 0.0 /100 | #330 | Tragic 1.9% |
| French Canadians | 0.0 /100 | #331 | Tragic 1.9% |
| Chippewa | 0.0 /100 | #332 | Tragic 1.9% |
| Dutch West Indians | 0.0 /100 | #333 | Tragic 1.9% |
Demographics Similar to Immigrants from Japan by Disability Age Under 5
In terms of disability age under 5, the demographic groups most similar to Immigrants from Japan are Immigrants from Russia (1.1%, a difference of 0.020%), Immigrants from Kazakhstan (1.1%, a difference of 0.19%), Immigrants from Singapore (1.1%, a difference of 0.22%), Immigrants from Sweden (1.1%, a difference of 0.44%), and Immigrants from Congo (1.1%, a difference of 0.58%).
| Demographics | Rating | Rank | Disability Age Under 5 |
| Pima | 99.8 /100 | #43 | Exceptional 1.1% |
| Immigrants | Asia | 99.8 /100 | #44 | Exceptional 1.1% |
| Immigrants | Turkey | 99.8 /100 | #45 | Exceptional 1.1% |
| Immigrants | Congo | 99.8 /100 | #46 | Exceptional 1.1% |
| Immigrants | Sweden | 99.8 /100 | #47 | Exceptional 1.1% |
| Immigrants | Singapore | 99.7 /100 | #48 | Exceptional 1.1% |
| Immigrants | Russia | 99.7 /100 | #49 | Exceptional 1.1% |
| Immigrants | Japan | 99.7 /100 | #50 | Exceptional 1.1% |
| Immigrants | Kazakhstan | 99.7 /100 | #51 | Exceptional 1.1% |
| Immigrants | Bolivia | 99.6 /100 | #52 | Exceptional 1.1% |
| Asians | 99.6 /100 | #53 | Exceptional 1.1% |
| Immigrants | El Salvador | 99.6 /100 | #54 | Exceptional 1.1% |
| Salvadorans | 99.5 /100 | #55 | Exceptional 1.1% |
| Ecuadorians | 99.5 /100 | #56 | Exceptional 1.1% |
| Assyrians/Chaldeans/Syriacs | 99.5 /100 | #57 | Exceptional 1.1% |