Apache vs Immigrants from Ukraine Disability Age Under 5
COMPARE
Apache
Immigrants from Ukraine
Disability Age Under 5
Disability Age Under 5 Comparison
Apache
Immigrants from Ukraine
2.0%
DISABILITY AGE UNDER 5
0.0/ 100
METRIC RATING
337th/ 347
METRIC RANK
1.0%
DISABILITY AGE UNDER 5
99.9/ 100
METRIC RATING
34th/ 347
METRIC RANK
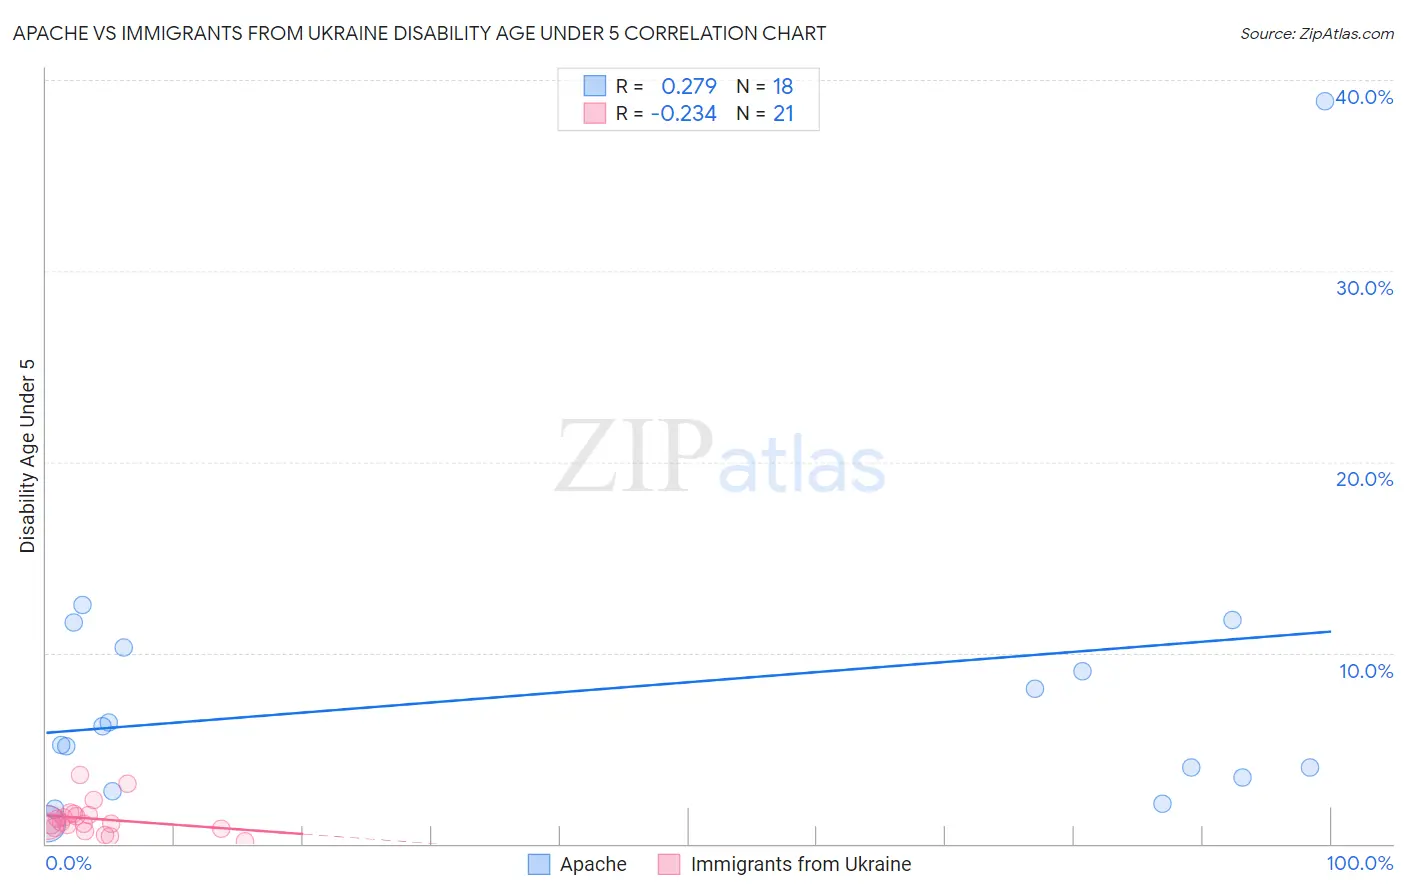
Apache vs Immigrants from Ukraine Disability Age Under 5 Correlation Chart
The statistical analysis conducted on geographies consisting of 152,093,425 people shows a weak positive correlation between the proportion of Apache and percentage of population with a disability under the age of 5 in the United States with a correlation coefficient (R) of 0.279 and weighted average of 2.0%. Similarly, the statistical analysis conducted on geographies consisting of 168,851,618 people shows a weak negative correlation between the proportion of Immigrants from Ukraine and percentage of population with a disability under the age of 5 in the United States with a correlation coefficient (R) of -0.234 and weighted average of 1.0%, a difference of 96.5%.
Disability Age Under 5 Correlation Summary
| Measurement | Apache | Immigrants from Ukraine |
| Minimum | 1.1% | 0.14% |
| Maximum | 38.9% | 3.6% |
| Range | 37.8% | 3.5% |
| Mean | 8.0% | 1.3% |
| Median | 5.7% | 1.1% |
| Interquartile 25% (IQ1) | 3.5% | 0.82% |
| Interquartile 75% (IQ3) | 10.3% | 1.5% |
| Interquartile Range (IQR) | 6.8% | 0.70% |
| Standard Deviation (Sample) | 8.5% | 0.83% |
| Standard Deviation (Population) | 8.3% | 0.81% |
Similar Demographics by Disability Age Under 5
Demographics Similar to Apache by Disability Age Under 5
In terms of disability age under 5, the demographic groups most similar to Apache are Paraguayan (2.0%, a difference of 2.9%), Pennsylvania German (1.9%, a difference of 4.2%), Native/Alaskan (1.9%, a difference of 4.6%), Dutch West Indian (1.9%, a difference of 5.0%), and Tohono O'odham (2.2%, a difference of 7.6%).
| Demographics | Rating | Rank | Disability Age Under 5 |
| Choctaw | 0.0 /100 | #330 | Tragic 1.9% |
| French Canadians | 0.0 /100 | #331 | Tragic 1.9% |
| Chippewa | 0.0 /100 | #332 | Tragic 1.9% |
| Dutch West Indians | 0.0 /100 | #333 | Tragic 1.9% |
| Natives/Alaskans | 0.0 /100 | #334 | Tragic 1.9% |
| Pennsylvania Germans | 0.0 /100 | #335 | Tragic 1.9% |
| Paraguayans | 0.0 /100 | #336 | Tragic 2.0% |
| Apache | 0.0 /100 | #337 | Tragic 2.0% |
| Tohono O'odham | 0.0 /100 | #338 | Tragic 2.2% |
| Immigrants | Azores | 0.0 /100 | #339 | Tragic 2.2% |
| Menominee | 0.0 /100 | #340 | Tragic 2.3% |
| Tsimshian | 0.0 /100 | #341 | Tragic 2.4% |
| Alaska Natives | 0.0 /100 | #342 | Tragic 2.9% |
| Colville | 0.0 /100 | #343 | Tragic 3.3% |
| Inupiat | 0.0 /100 | #344 | Tragic 3.7% |
Demographics Similar to Immigrants from Ukraine by Disability Age Under 5
In terms of disability age under 5, the demographic groups most similar to Immigrants from Ukraine are Bolivian (1.0%, a difference of 0.12%), Barbadian (1.0%, a difference of 0.24%), Iranian (1.0%, a difference of 0.29%), Armenian (1.0%, a difference of 0.34%), and Immigrants from South Central Asia (1.0%, a difference of 0.63%).
| Demographics | Rating | Rank | Disability Age Under 5 |
| Guyanese | 100.0 /100 | #27 | Exceptional 1.0% |
| Immigrants | Eastern Asia | 100.0 /100 | #28 | Exceptional 1.0% |
| Immigrants | Belarus | 100.0 /100 | #29 | Exceptional 1.0% |
| Immigrants | South Central Asia | 99.9 /100 | #30 | Exceptional 1.0% |
| Armenians | 99.9 /100 | #31 | Exceptional 1.0% |
| Iranians | 99.9 /100 | #32 | Exceptional 1.0% |
| Bolivians | 99.9 /100 | #33 | Exceptional 1.0% |
| Immigrants | Ukraine | 99.9 /100 | #34 | Exceptional 1.0% |
| Barbadians | 99.9 /100 | #35 | Exceptional 1.0% |
| Immigrants | Nepal | 99.9 /100 | #36 | Exceptional 1.0% |
| Immigrants | India | 99.9 /100 | #37 | Exceptional 1.0% |
| Immigrants | Guyana | 99.9 /100 | #38 | Exceptional 1.0% |
| Filipinos | 99.9 /100 | #39 | Exceptional 1.1% |
| Immigrants | Albania | 99.9 /100 | #40 | Exceptional 1.1% |
| Thais | 99.8 /100 | #41 | Exceptional 1.1% |