Nepalese vs Immigrants from Ukraine Disability Age Under 5
COMPARE
Nepalese
Immigrants from Ukraine
Disability Age Under 5
Disability Age Under 5 Comparison
Nepalese
Immigrants from Ukraine
0.97%
DISABILITY AGE UNDER 5
100.0/ 100
METRIC RATING
20th/ 347
METRIC RANK
1.0%
DISABILITY AGE UNDER 5
99.9/ 100
METRIC RATING
34th/ 347
METRIC RANK
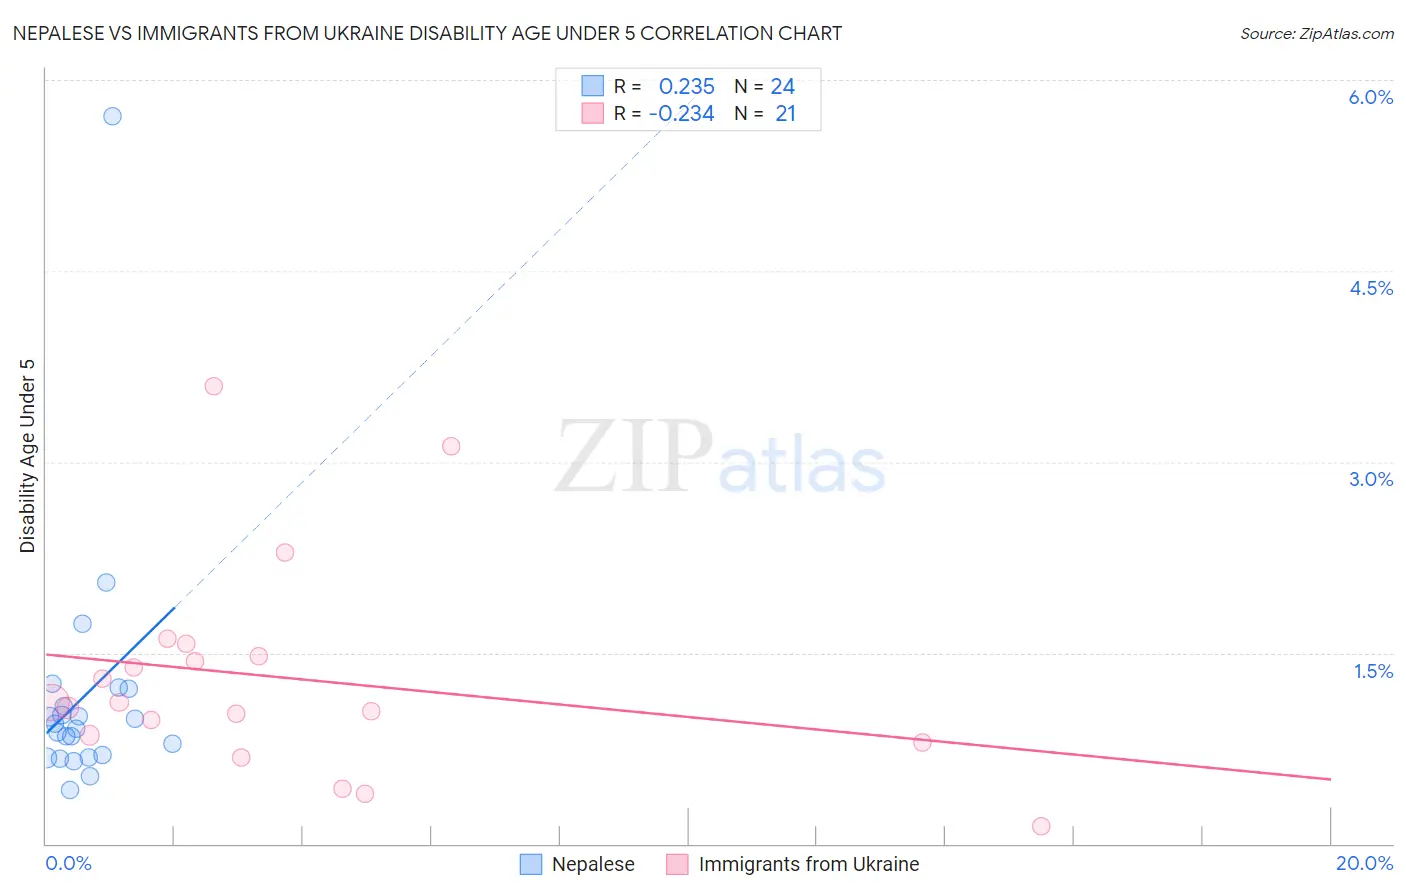
Nepalese vs Immigrants from Ukraine Disability Age Under 5 Correlation Chart
The statistical analysis conducted on geographies consisting of 20,092,908 people shows a weak positive correlation between the proportion of Nepalese and percentage of population with a disability under the age of 5 in the United States with a correlation coefficient (R) of 0.235 and weighted average of 0.97%. Similarly, the statistical analysis conducted on geographies consisting of 168,851,618 people shows a weak negative correlation between the proportion of Immigrants from Ukraine and percentage of population with a disability under the age of 5 in the United States with a correlation coefficient (R) of -0.234 and weighted average of 1.0%, a difference of 6.3%.
Disability Age Under 5 Correlation Summary
| Measurement | Nepalese | Immigrants from Ukraine |
| Minimum | 0.43% | 0.14% |
| Maximum | 5.7% | 3.6% |
| Range | 5.3% | 3.5% |
| Mean | 1.2% | 1.3% |
| Median | 0.93% | 1.1% |
| Interquartile 25% (IQ1) | 0.69% | 0.82% |
| Interquartile 75% (IQ3) | 1.2% | 1.5% |
| Interquartile Range (IQR) | 0.46% | 0.70% |
| Standard Deviation (Sample) | 1.0% | 0.83% |
| Standard Deviation (Population) | 1.0% | 0.81% |
Demographics Similar to Nepalese and Immigrants from Ukraine by Disability Age Under 5
In terms of disability age under 5, the demographic groups most similar to Nepalese are Puget Sound Salish (0.97%, a difference of 0.10%), Immigrants from Barbados (0.97%, a difference of 0.47%), Immigrants from China (0.96%, a difference of 1.1%), British West Indian (0.99%, a difference of 1.8%), and Immigrants from Iran (1.00%, a difference of 2.6%). Similarly, the demographic groups most similar to Immigrants from Ukraine are Bolivian (1.0%, a difference of 0.12%), Barbadian (1.0%, a difference of 0.24%), Iranian (1.0%, a difference of 0.29%), Armenian (1.0%, a difference of 0.34%), and Immigrants from South Central Asia (1.0%, a difference of 0.63%).
| Demographics | Rating | Rank | Disability Age Under 5 |
| Immigrants | China | 100.0 /100 | #17 | Exceptional 0.96% |
| Immigrants | Barbados | 100.0 /100 | #18 | Exceptional 0.97% |
| Puget Sound Salish | 100.0 /100 | #19 | Exceptional 0.97% |
| Nepalese | 100.0 /100 | #20 | Exceptional 0.97% |
| British West Indians | 100.0 /100 | #21 | Exceptional 0.99% |
| Immigrants | Iran | 100.0 /100 | #22 | Exceptional 1.00% |
| Yakama | 100.0 /100 | #23 | Exceptional 1.00% |
| Indians (Asian) | 100.0 /100 | #24 | Exceptional 1.0% |
| Immigrants | Micronesia | 100.0 /100 | #25 | Exceptional 1.0% |
| Immigrants | Taiwan | 100.0 /100 | #26 | Exceptional 1.0% |
| Guyanese | 100.0 /100 | #27 | Exceptional 1.0% |
| Immigrants | Eastern Asia | 100.0 /100 | #28 | Exceptional 1.0% |
| Immigrants | Belarus | 100.0 /100 | #29 | Exceptional 1.0% |
| Immigrants | South Central Asia | 99.9 /100 | #30 | Exceptional 1.0% |
| Armenians | 99.9 /100 | #31 | Exceptional 1.0% |
| Iranians | 99.9 /100 | #32 | Exceptional 1.0% |
| Bolivians | 99.9 /100 | #33 | Exceptional 1.0% |
| Immigrants | Ukraine | 99.9 /100 | #34 | Exceptional 1.0% |
| Barbadians | 99.9 /100 | #35 | Exceptional 1.0% |
| Immigrants | Nepal | 99.9 /100 | #36 | Exceptional 1.0% |
| Immigrants | India | 99.9 /100 | #37 | Exceptional 1.0% |