Alaskan Athabascan vs Immigrants from St. Vincent and the Grenadines Disability
COMPARE
Alaskan Athabascan
Immigrants from St. Vincent and the Grenadines
Disability
Disability Comparison
Alaskan Athabascans
Immigrants from St. Vincent and the Grenadines
14.4%
DISABILITY
0.0/ 100
METRIC RATING
331st/ 347
METRIC RANK
11.4%
DISABILITY
87.8/ 100
METRIC RATING
136th/ 347
METRIC RANK
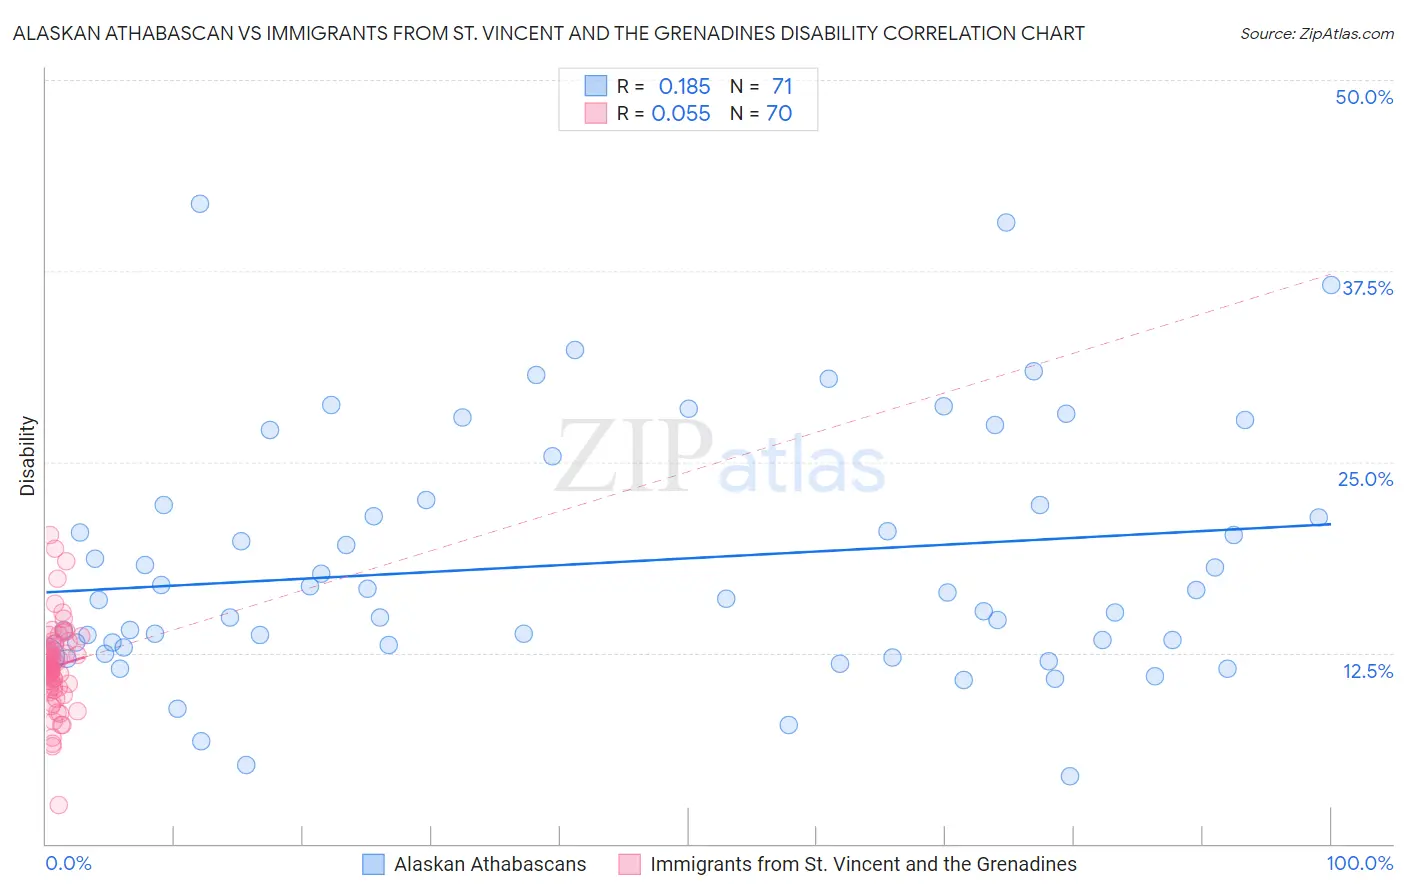
Alaskan Athabascan vs Immigrants from St. Vincent and the Grenadines Disability Correlation Chart
The statistical analysis conducted on geographies consisting of 45,821,092 people shows a poor positive correlation between the proportion of Alaskan Athabascans and percentage of population with a disability in the United States with a correlation coefficient (R) of 0.185 and weighted average of 14.4%. Similarly, the statistical analysis conducted on geographies consisting of 56,172,904 people shows a slight positive correlation between the proportion of Immigrants from St. Vincent and the Grenadines and percentage of population with a disability in the United States with a correlation coefficient (R) of 0.055 and weighted average of 11.4%, a difference of 26.2%.
Disability Correlation Summary
| Measurement | Alaskan Athabascan | Immigrants from St. Vincent and the Grenadines |
| Minimum | 4.4% | 2.5% |
| Maximum | 41.9% | 20.2% |
| Range | 37.5% | 17.7% |
| Mean | 18.3% | 11.6% |
| Median | 16.0% | 11.6% |
| Interquartile 25% (IQ1) | 13.0% | 10.2% |
| Interquartile 75% (IQ3) | 22.2% | 12.8% |
| Interquartile Range (IQR) | 9.2% | 2.5% |
| Standard Deviation (Sample) | 8.0% | 2.9% |
| Standard Deviation (Population) | 8.0% | 2.9% |
Similar Demographics by Disability
Demographics Similar to Alaskan Athabascans by Disability
In terms of disability, the demographic groups most similar to Alaskan Athabascans are Pueblo (14.4%, a difference of 0.020%), Cajun (14.6%, a difference of 1.1%), Yuman (14.6%, a difference of 1.2%), Navajo (14.3%, a difference of 1.3%), and Potawatomi (14.2%, a difference of 1.9%).
| Demographics | Rating | Rank | Disability |
| Chippewa | 0.0 /100 | #324 | Tragic 14.1% |
| Natives/Alaskans | 0.0 /100 | #325 | Tragic 14.2% |
| Osage | 0.0 /100 | #326 | Tragic 14.2% |
| Ottawa | 0.0 /100 | #327 | Tragic 14.2% |
| Immigrants | Azores | 0.0 /100 | #328 | Tragic 14.2% |
| Potawatomi | 0.0 /100 | #329 | Tragic 14.2% |
| Navajo | 0.0 /100 | #330 | Tragic 14.3% |
| Alaskan Athabascans | 0.0 /100 | #331 | Tragic 14.4% |
| Pueblo | 0.0 /100 | #332 | Tragic 14.4% |
| Cajuns | 0.0 /100 | #333 | Tragic 14.6% |
| Yuman | 0.0 /100 | #334 | Tragic 14.6% |
| Tohono O'odham | 0.0 /100 | #335 | Tragic 14.8% |
| Cherokee | 0.0 /100 | #336 | Tragic 14.8% |
| Seminole | 0.0 /100 | #337 | Tragic 14.9% |
| Dutch West Indians | 0.0 /100 | #338 | Tragic 14.9% |
Demographics Similar to Immigrants from St. Vincent and the Grenadines by Disability
In terms of disability, the demographic groups most similar to Immigrants from St. Vincent and the Grenadines are Ugandan (11.4%, a difference of 0.010%), Immigrants from Guyana (11.4%, a difference of 0.060%), Kenyan (11.5%, a difference of 0.070%), New Zealander (11.5%, a difference of 0.080%), and Ghanaian (11.5%, a difference of 0.080%).
| Demographics | Rating | Rank | Disability |
| Macedonians | 90.3 /100 | #129 | Exceptional 11.4% |
| Latvians | 89.8 /100 | #130 | Excellent 11.4% |
| Immigrants | Croatia | 89.8 /100 | #131 | Excellent 11.4% |
| Immigrants | Africa | 89.3 /100 | #132 | Excellent 11.4% |
| Arabs | 89.1 /100 | #133 | Excellent 11.4% |
| Immigrants | Guyana | 88.3 /100 | #134 | Excellent 11.4% |
| Ugandans | 87.9 /100 | #135 | Excellent 11.4% |
| Immigrants | St. Vincent and the Grenadines | 87.8 /100 | #136 | Excellent 11.4% |
| Kenyans | 87.1 /100 | #137 | Excellent 11.5% |
| New Zealanders | 87.0 /100 | #138 | Excellent 11.5% |
| Ghanaians | 87.0 /100 | #139 | Excellent 11.5% |
| Russians | 86.8 /100 | #140 | Excellent 11.5% |
| Immigrants | Grenada | 86.1 /100 | #141 | Excellent 11.5% |
| Immigrants | Sudan | 85.3 /100 | #142 | Excellent 11.5% |
| Moroccans | 83.3 /100 | #143 | Excellent 11.5% |