Immigrants from Costa Rica vs Immigrants from St. Vincent and the Grenadines Disability
COMPARE
Immigrants from Costa Rica
Immigrants from St. Vincent and the Grenadines
Disability
Disability Comparison
Immigrants from Costa Rica
Immigrants from St. Vincent and the Grenadines
11.4%
DISABILITY
93.4/ 100
METRIC RATING
121st/ 347
METRIC RANK
11.4%
DISABILITY
87.8/ 100
METRIC RATING
136th/ 347
METRIC RANK
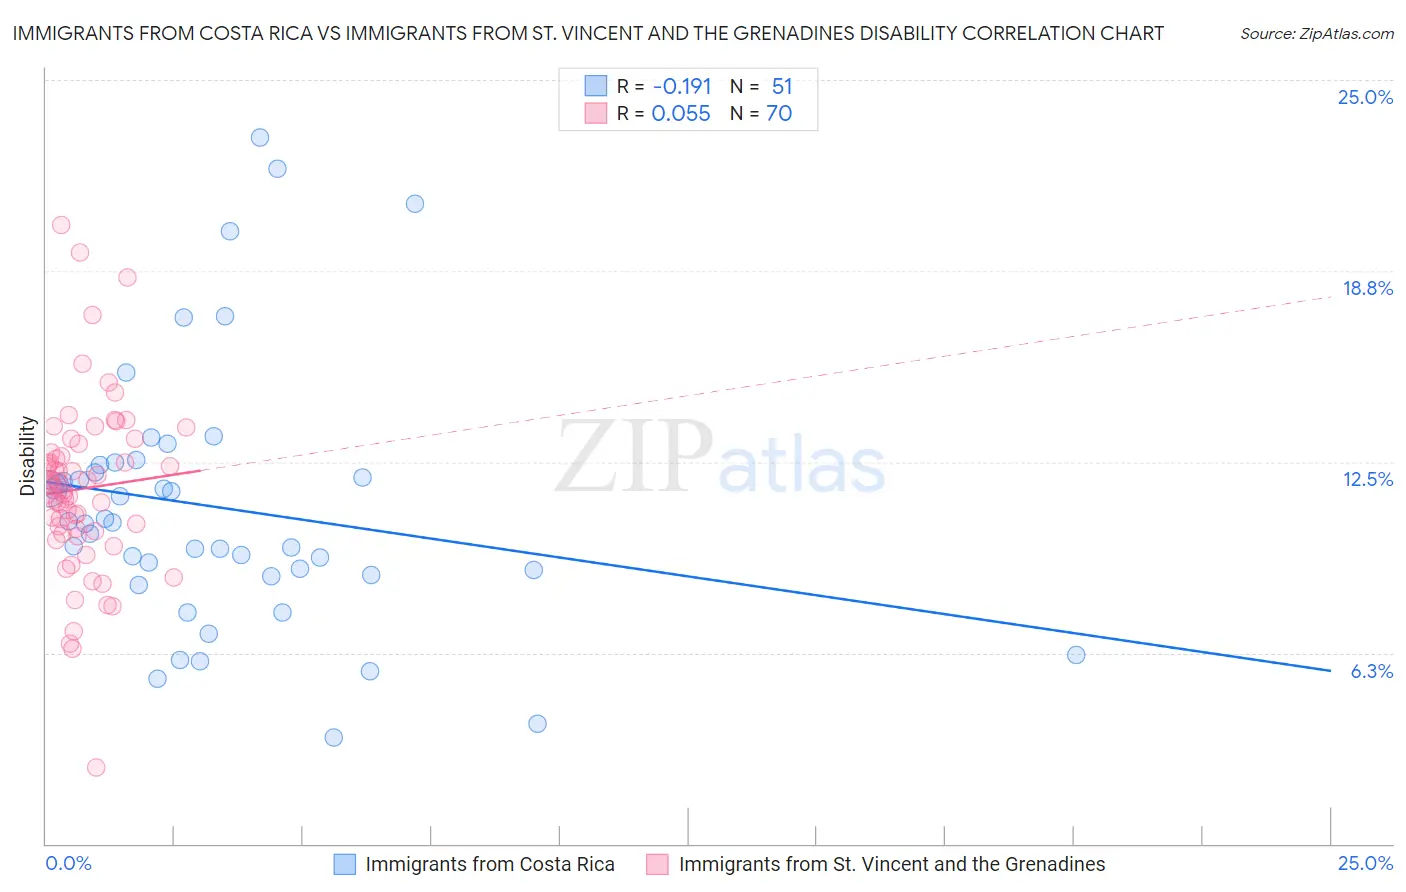
Immigrants from Costa Rica vs Immigrants from St. Vincent and the Grenadines Disability Correlation Chart
The statistical analysis conducted on geographies consisting of 204,275,653 people shows a poor negative correlation between the proportion of Immigrants from Costa Rica and percentage of population with a disability in the United States with a correlation coefficient (R) of -0.191 and weighted average of 11.4%. Similarly, the statistical analysis conducted on geographies consisting of 56,172,904 people shows a slight positive correlation between the proportion of Immigrants from St. Vincent and the Grenadines and percentage of population with a disability in the United States with a correlation coefficient (R) of 0.055 and weighted average of 11.4%, a difference of 0.78%.
Disability Correlation Summary
| Measurement | Immigrants from Costa Rica | Immigrants from St. Vincent and the Grenadines |
| Minimum | 3.5% | 2.5% |
| Maximum | 23.1% | 20.2% |
| Range | 19.6% | 17.7% |
| Mean | 11.0% | 11.6% |
| Median | 10.5% | 11.6% |
| Interquartile 25% (IQ1) | 8.8% | 10.2% |
| Interquartile 75% (IQ3) | 12.4% | 12.8% |
| Interquartile Range (IQR) | 3.6% | 2.5% |
| Standard Deviation (Sample) | 4.2% | 2.9% |
| Standard Deviation (Population) | 4.2% | 2.9% |
Demographics Similar to Immigrants from Costa Rica and Immigrants from St. Vincent and the Grenadines by Disability
In terms of disability, the demographic groups most similar to Immigrants from Costa Rica are Central American (11.4%, a difference of 0.010%), Immigrants from North Macedonia (11.4%, a difference of 0.010%), Brazilian (11.4%, a difference of 0.020%), Korean (11.3%, a difference of 0.070%), and South African (11.4%, a difference of 0.20%). Similarly, the demographic groups most similar to Immigrants from St. Vincent and the Grenadines are Ugandan (11.4%, a difference of 0.010%), Immigrants from Guyana (11.4%, a difference of 0.060%), Kenyan (11.5%, a difference of 0.070%), New Zealander (11.5%, a difference of 0.080%), and Arab (11.4%, a difference of 0.14%).
| Demographics | Rating | Rank | Disability |
| Koreans | 93.8 /100 | #118 | Exceptional 11.3% |
| Central Americans | 93.5 /100 | #119 | Exceptional 11.4% |
| Immigrants | North Macedonia | 93.5 /100 | #120 | Exceptional 11.4% |
| Immigrants | Costa Rica | 93.4 /100 | #121 | Exceptional 11.4% |
| Brazilians | 93.3 /100 | #122 | Exceptional 11.4% |
| South Africans | 92.3 /100 | #123 | Exceptional 11.4% |
| South American Indians | 92.2 /100 | #124 | Exceptional 11.4% |
| Costa Ricans | 91.9 /100 | #125 | Exceptional 11.4% |
| Immigrants | Latvia | 90.9 /100 | #126 | Exceptional 11.4% |
| Immigrants | Italy | 90.4 /100 | #127 | Exceptional 11.4% |
| Immigrants | Europe | 90.4 /100 | #128 | Exceptional 11.4% |
| Macedonians | 90.3 /100 | #129 | Exceptional 11.4% |
| Latvians | 89.8 /100 | #130 | Excellent 11.4% |
| Immigrants | Croatia | 89.8 /100 | #131 | Excellent 11.4% |
| Immigrants | Africa | 89.3 /100 | #132 | Excellent 11.4% |
| Arabs | 89.1 /100 | #133 | Excellent 11.4% |
| Immigrants | Guyana | 88.3 /100 | #134 | Excellent 11.4% |
| Ugandans | 87.9 /100 | #135 | Excellent 11.4% |
| Immigrants | St. Vincent and the Grenadines | 87.8 /100 | #136 | Excellent 11.4% |
| Kenyans | 87.1 /100 | #137 | Excellent 11.5% |
| New Zealanders | 87.0 /100 | #138 | Excellent 11.5% |