Immigrants from Turkey vs Immigrants from Sierra Leone Disability
COMPARE
Immigrants from Turkey
Immigrants from Sierra Leone
Disability
Disability Comparison
Immigrants from Turkey
Immigrants from Sierra Leone
10.6%
DISABILITY
100.0/ 100
METRIC RATING
30th/ 347
METRIC RANK
11.1%
DISABILITY
99.0/ 100
METRIC RATING
84th/ 347
METRIC RANK
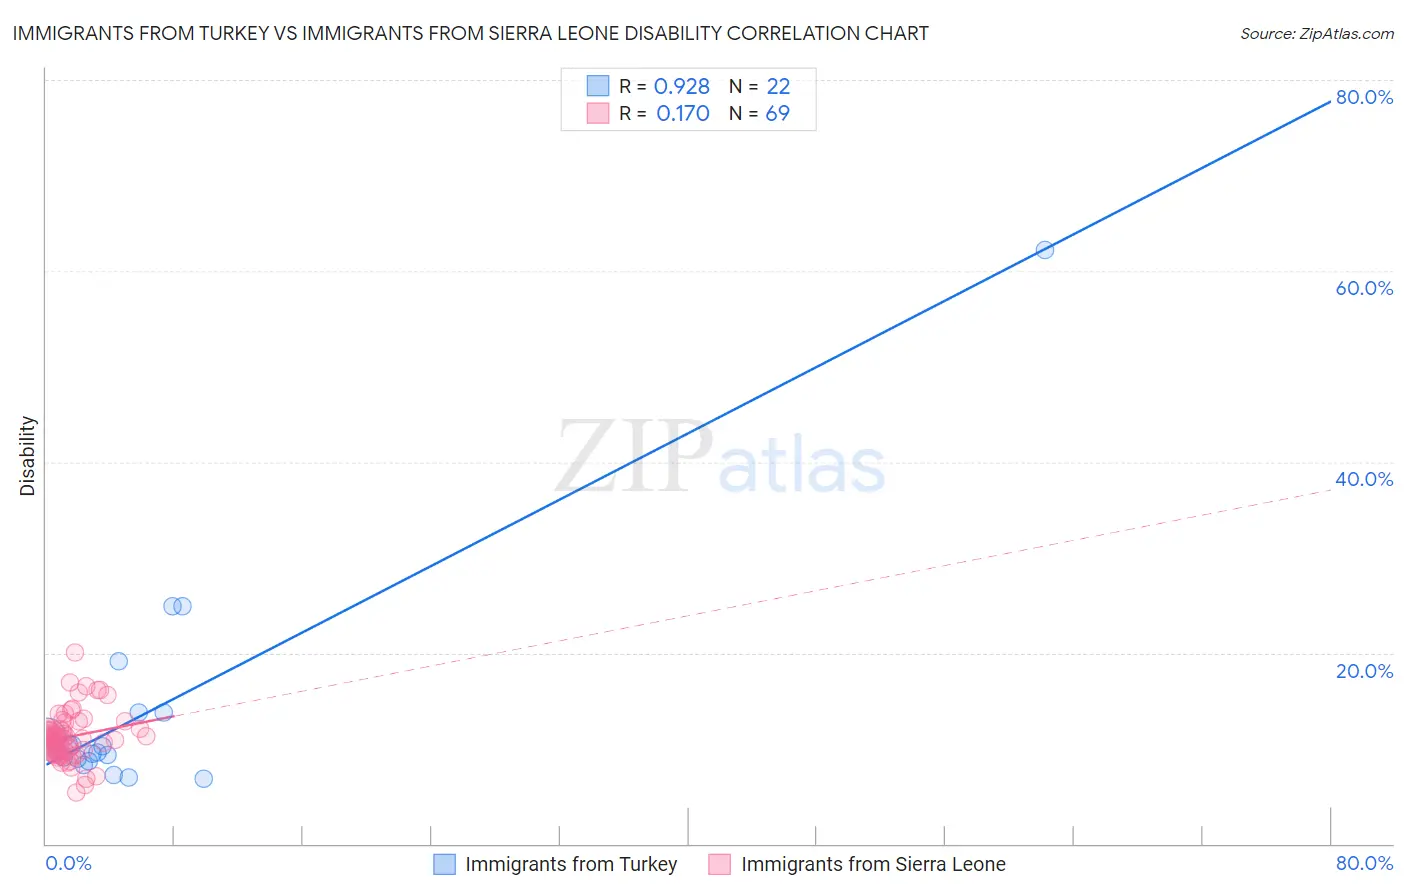
Immigrants from Turkey vs Immigrants from Sierra Leone Disability Correlation Chart
The statistical analysis conducted on geographies consisting of 223,052,845 people shows a near-perfect positive correlation between the proportion of Immigrants from Turkey and percentage of population with a disability in the United States with a correlation coefficient (R) of 0.928 and weighted average of 10.6%. Similarly, the statistical analysis conducted on geographies consisting of 101,651,633 people shows a poor positive correlation between the proportion of Immigrants from Sierra Leone and percentage of population with a disability in the United States with a correlation coefficient (R) of 0.170 and weighted average of 11.1%, a difference of 4.4%.
Disability Correlation Summary
| Measurement | Immigrants from Turkey | Immigrants from Sierra Leone |
| Minimum | 6.9% | 5.4% |
| Maximum | 62.2% | 20.1% |
| Range | 55.3% | 14.7% |
| Mean | 13.8% | 11.2% |
| Median | 9.6% | 11.1% |
| Interquartile 25% (IQ1) | 8.9% | 9.6% |
| Interquartile 75% (IQ3) | 13.8% | 12.1% |
| Interquartile Range (IQR) | 4.8% | 2.6% |
| Standard Deviation (Sample) | 11.9% | 2.6% |
| Standard Deviation (Population) | 11.7% | 2.6% |
Similar Demographics by Disability
Demographics Similar to Immigrants from Turkey by Disability
In terms of disability, the demographic groups most similar to Immigrants from Turkey are Immigrants from Egypt (10.6%, a difference of 0.070%), Immigrants from Argentina (10.6%, a difference of 0.15%), Paraguayan (10.6%, a difference of 0.17%), Egyptian (10.6%, a difference of 0.28%), and Cypriot (10.6%, a difference of 0.41%).
| Demographics | Rating | Rank | Disability |
| Immigrants | Asia | 100.0 /100 | #23 | Exceptional 10.5% |
| Venezuelans | 100.0 /100 | #24 | Exceptional 10.5% |
| Immigrants | Malaysia | 100.0 /100 | #25 | Exceptional 10.6% |
| Argentineans | 100.0 /100 | #26 | Exceptional 10.6% |
| Cypriots | 100.0 /100 | #27 | Exceptional 10.6% |
| Egyptians | 100.0 /100 | #28 | Exceptional 10.6% |
| Immigrants | Argentina | 100.0 /100 | #29 | Exceptional 10.6% |
| Immigrants | Turkey | 100.0 /100 | #30 | Exceptional 10.6% |
| Immigrants | Egypt | 100.0 /100 | #31 | Exceptional 10.6% |
| Paraguayans | 100.0 /100 | #32 | Exceptional 10.6% |
| Immigrants | Kuwait | 100.0 /100 | #33 | Exceptional 10.7% |
| Immigrants | Ethiopia | 100.0 /100 | #34 | Exceptional 10.7% |
| Immigrants | Indonesia | 100.0 /100 | #35 | Exceptional 10.7% |
| Ethiopians | 100.0 /100 | #36 | Exceptional 10.7% |
| Turks | 100.0 /100 | #37 | Exceptional 10.7% |
Demographics Similar to Immigrants from Sierra Leone by Disability
In terms of disability, the demographic groups most similar to Immigrants from Sierra Leone are Immigrants from Switzerland (11.1%, a difference of 0.010%), Chilean (11.1%, a difference of 0.050%), Immigrants from Poland (11.1%, a difference of 0.090%), Immigrants from Belarus (11.1%, a difference of 0.15%), and Immigrants from Russia (11.1%, a difference of 0.15%).
| Demographics | Rating | Rank | Disability |
| Immigrants | Belgium | 99.3 /100 | #77 | Exceptional 11.0% |
| Immigrants | Cameroon | 99.3 /100 | #78 | Exceptional 11.1% |
| Immigrants | Jordan | 99.3 /100 | #79 | Exceptional 11.1% |
| Immigrants | Ireland | 99.3 /100 | #80 | Exceptional 11.1% |
| Immigrants | Poland | 99.1 /100 | #81 | Exceptional 11.1% |
| Chileans | 99.1 /100 | #82 | Exceptional 11.1% |
| Immigrants | Switzerland | 99.0 /100 | #83 | Exceptional 11.1% |
| Immigrants | Sierra Leone | 99.0 /100 | #84 | Exceptional 11.1% |
| Immigrants | Belarus | 98.9 /100 | #85 | Exceptional 11.1% |
| Immigrants | Russia | 98.9 /100 | #86 | Exceptional 11.1% |
| Palestinians | 98.9 /100 | #87 | Exceptional 11.1% |
| Immigrants | Romania | 98.5 /100 | #88 | Exceptional 11.2% |
| Immigrants | South Africa | 98.2 /100 | #89 | Exceptional 11.2% |
| Immigrants | Brazil | 98.1 /100 | #90 | Exceptional 11.2% |
| Immigrants | Western Asia | 98.1 /100 | #91 | Exceptional 11.2% |