Blackfeet vs Immigrants from Sierra Leone Disability
COMPARE
Blackfeet
Immigrants from Sierra Leone
Disability
Disability Comparison
Blackfeet
Immigrants from Sierra Leone
13.6%
DISABILITY
0.0/ 100
METRIC RATING
310th/ 347
METRIC RANK
11.1%
DISABILITY
99.0/ 100
METRIC RATING
84th/ 347
METRIC RANK
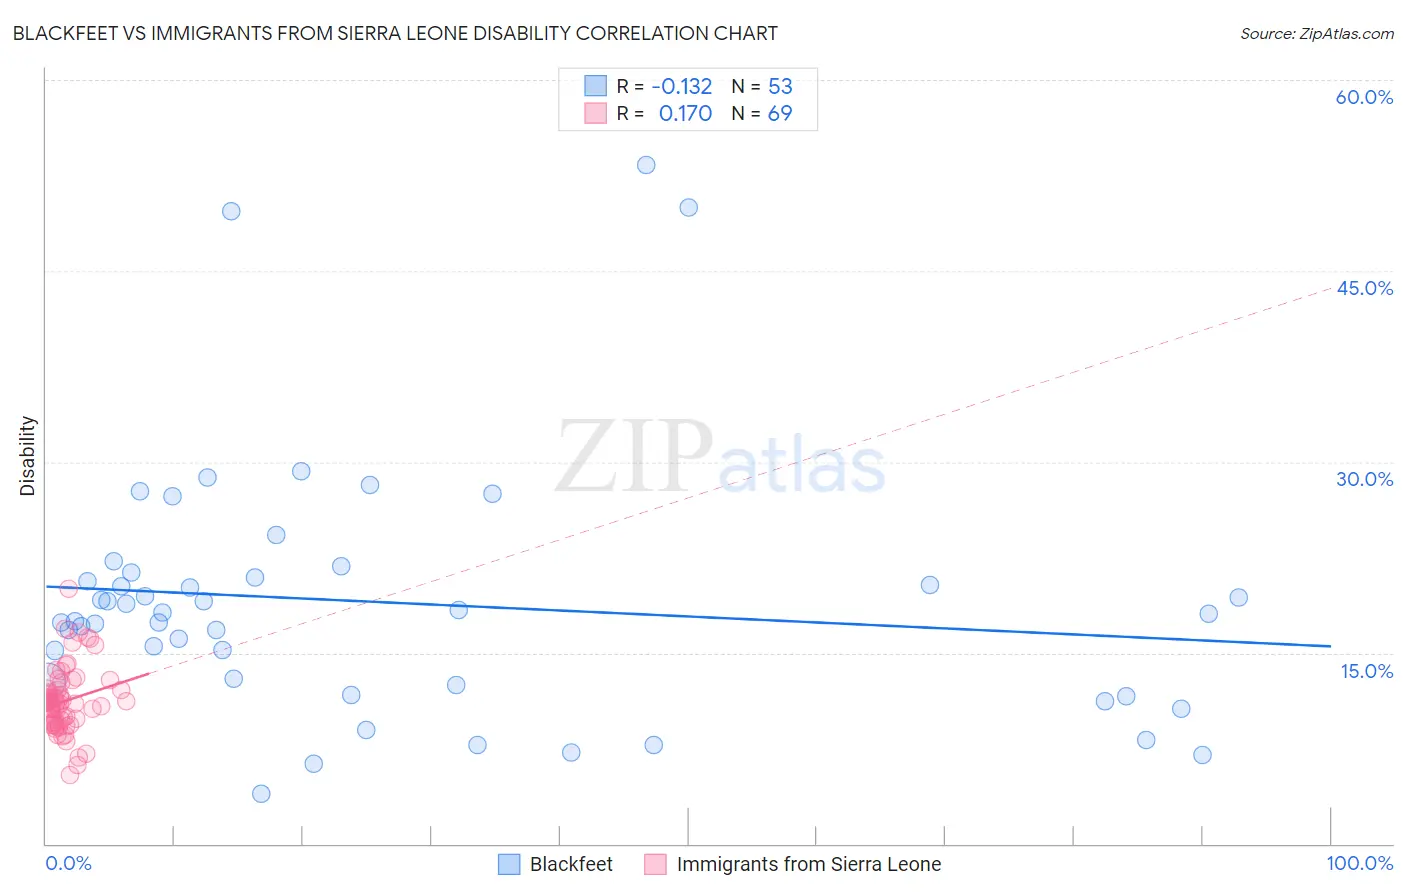
Blackfeet vs Immigrants from Sierra Leone Disability Correlation Chart
The statistical analysis conducted on geographies consisting of 309,516,327 people shows a poor negative correlation between the proportion of Blackfeet and percentage of population with a disability in the United States with a correlation coefficient (R) of -0.132 and weighted average of 13.6%. Similarly, the statistical analysis conducted on geographies consisting of 101,651,633 people shows a poor positive correlation between the proportion of Immigrants from Sierra Leone and percentage of population with a disability in the United States with a correlation coefficient (R) of 0.170 and weighted average of 11.1%, a difference of 22.6%.
Disability Correlation Summary
| Measurement | Blackfeet | Immigrants from Sierra Leone |
| Minimum | 4.0% | 5.4% |
| Maximum | 53.3% | 20.1% |
| Range | 49.4% | 14.7% |
| Mean | 19.0% | 11.2% |
| Median | 18.1% | 11.1% |
| Interquartile 25% (IQ1) | 12.6% | 9.6% |
| Interquartile 75% (IQ3) | 21.1% | 12.1% |
| Interquartile Range (IQR) | 8.5% | 2.6% |
| Standard Deviation (Sample) | 10.0% | 2.6% |
| Standard Deviation (Population) | 9.9% | 2.6% |
Similar Demographics by Disability
Demographics Similar to Blackfeet by Disability
In terms of disability, the demographic groups most similar to Blackfeet are Delaware (13.6%, a difference of 0.040%), Spanish American (13.6%, a difference of 0.28%), Tlingit-Haida (13.5%, a difference of 0.53%), French American Indian (13.5%, a difference of 0.61%), and Cree (13.7%, a difference of 0.63%).
| Demographics | Rating | Rank | Disability |
| Scotch-Irish | 0.0 /100 | #303 | Tragic 13.3% |
| Yakama | 0.0 /100 | #304 | Tragic 13.4% |
| French Canadians | 0.0 /100 | #305 | Tragic 13.4% |
| Cape Verdeans | 0.0 /100 | #306 | Tragic 13.5% |
| Shoshone | 0.0 /100 | #307 | Tragic 13.5% |
| French American Indians | 0.0 /100 | #308 | Tragic 13.5% |
| Tlingit-Haida | 0.0 /100 | #309 | Tragic 13.5% |
| Blackfeet | 0.0 /100 | #310 | Tragic 13.6% |
| Delaware | 0.0 /100 | #311 | Tragic 13.6% |
| Spanish Americans | 0.0 /100 | #312 | Tragic 13.6% |
| Cree | 0.0 /100 | #313 | Tragic 13.7% |
| Blacks/African Americans | 0.0 /100 | #314 | Tragic 13.7% |
| Puget Sound Salish | 0.0 /100 | #315 | Tragic 13.7% |
| Pima | 0.0 /100 | #316 | Tragic 13.7% |
| Immigrants | Cabo Verde | 0.0 /100 | #317 | Tragic 13.7% |
Demographics Similar to Immigrants from Sierra Leone by Disability
In terms of disability, the demographic groups most similar to Immigrants from Sierra Leone are Immigrants from Switzerland (11.1%, a difference of 0.010%), Chilean (11.1%, a difference of 0.050%), Immigrants from Poland (11.1%, a difference of 0.090%), Immigrants from Belarus (11.1%, a difference of 0.15%), and Immigrants from Russia (11.1%, a difference of 0.15%).
| Demographics | Rating | Rank | Disability |
| Immigrants | Belgium | 99.3 /100 | #77 | Exceptional 11.0% |
| Immigrants | Cameroon | 99.3 /100 | #78 | Exceptional 11.1% |
| Immigrants | Jordan | 99.3 /100 | #79 | Exceptional 11.1% |
| Immigrants | Ireland | 99.3 /100 | #80 | Exceptional 11.1% |
| Immigrants | Poland | 99.1 /100 | #81 | Exceptional 11.1% |
| Chileans | 99.1 /100 | #82 | Exceptional 11.1% |
| Immigrants | Switzerland | 99.0 /100 | #83 | Exceptional 11.1% |
| Immigrants | Sierra Leone | 99.0 /100 | #84 | Exceptional 11.1% |
| Immigrants | Belarus | 98.9 /100 | #85 | Exceptional 11.1% |
| Immigrants | Russia | 98.9 /100 | #86 | Exceptional 11.1% |
| Palestinians | 98.9 /100 | #87 | Exceptional 11.1% |
| Immigrants | Romania | 98.5 /100 | #88 | Exceptional 11.2% |
| Immigrants | South Africa | 98.2 /100 | #89 | Exceptional 11.2% |
| Immigrants | Brazil | 98.1 /100 | #90 | Exceptional 11.2% |
| Immigrants | Western Asia | 98.1 /100 | #91 | Exceptional 11.2% |