Immigrants from Sweden vs Immigrants from Eastern Europe Disability
COMPARE
Immigrants from Sweden
Immigrants from Eastern Europe
Disability
Disability Comparison
Immigrants from Sweden
Immigrants from Eastern Europe
11.0%
DISABILITY
99.6/ 100
METRIC RATING
64th/ 347
METRIC RANK
11.3%
DISABILITY
96.3/ 100
METRIC RATING
106th/ 347
METRIC RANK
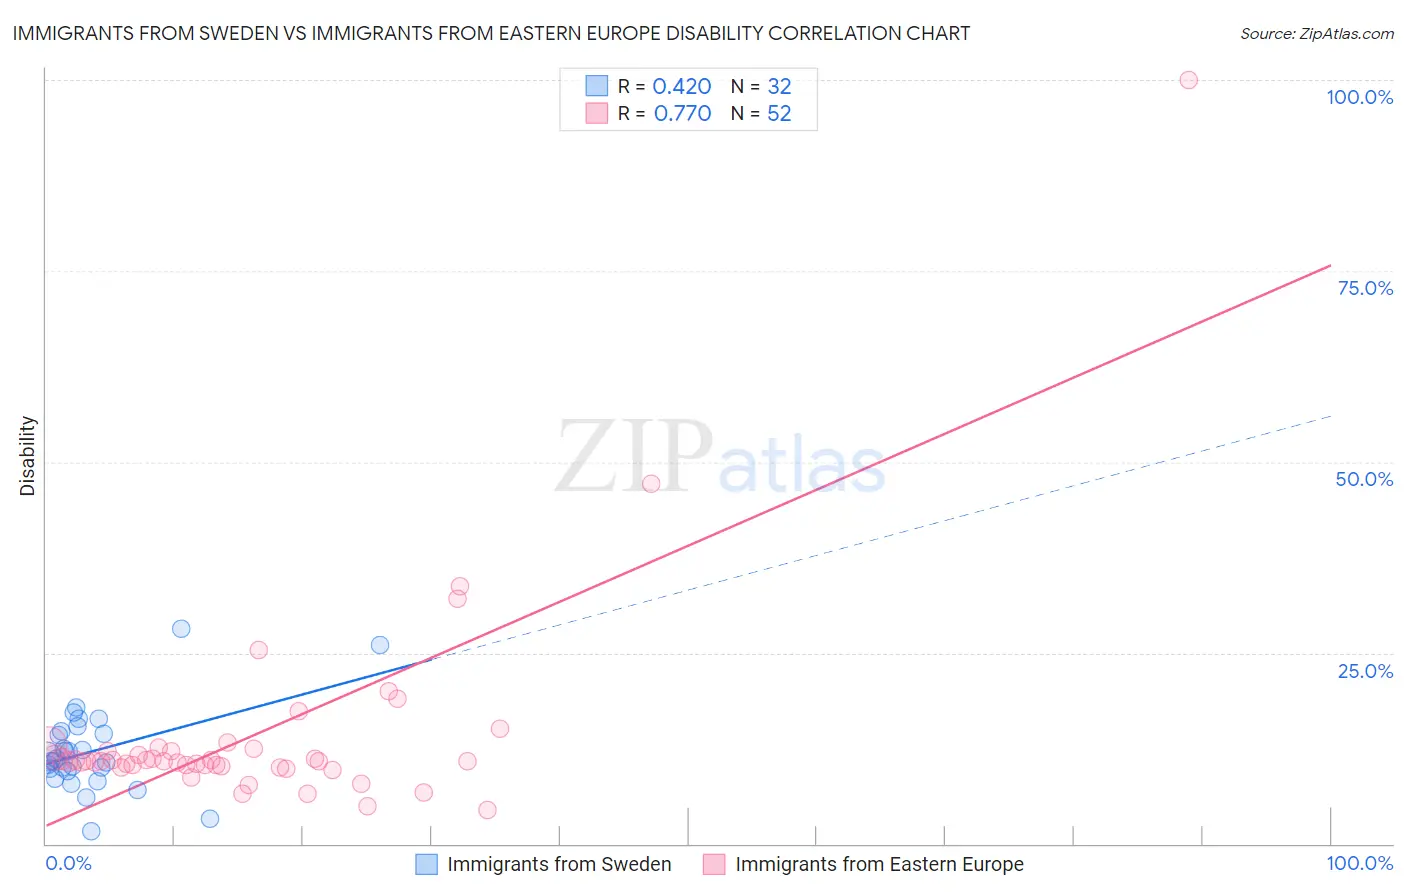
Immigrants from Sweden vs Immigrants from Eastern Europe Disability Correlation Chart
The statistical analysis conducted on geographies consisting of 164,749,028 people shows a moderate positive correlation between the proportion of Immigrants from Sweden and percentage of population with a disability in the United States with a correlation coefficient (R) of 0.420 and weighted average of 11.0%. Similarly, the statistical analysis conducted on geographies consisting of 475,819,373 people shows a strong positive correlation between the proportion of Immigrants from Eastern Europe and percentage of population with a disability in the United States with a correlation coefficient (R) of 0.770 and weighted average of 11.3%, a difference of 2.8%.
Disability Correlation Summary
| Measurement | Immigrants from Sweden | Immigrants from Eastern Europe |
| Minimum | 1.7% | 4.4% |
| Maximum | 28.1% | 100.0% |
| Range | 26.4% | 95.6% |
| Mean | 12.1% | 14.4% |
| Median | 11.0% | 10.8% |
| Interquartile 25% (IQ1) | 9.6% | 10.2% |
| Interquartile 75% (IQ3) | 14.6% | 12.3% |
| Interquartile Range (IQR) | 4.9% | 2.1% |
| Standard Deviation (Sample) | 5.4% | 14.1% |
| Standard Deviation (Population) | 5.3% | 14.0% |
Similar Demographics by Disability
Demographics Similar to Immigrants from Sweden by Disability
In terms of disability, the demographic groups most similar to Immigrants from Sweden are Bulgarian (11.0%, a difference of 0.020%), Laotian (11.0%, a difference of 0.030%), Colombian (11.0%, a difference of 0.11%), Immigrants from Eritrea (11.0%, a difference of 0.18%), and Immigrants from Northern Africa (10.9%, a difference of 0.20%).
| Demographics | Rating | Rank | Disability |
| Salvadorans | 99.8 /100 | #57 | Exceptional 10.9% |
| Immigrants | South America | 99.8 /100 | #58 | Exceptional 10.9% |
| Immigrants | Colombia | 99.7 /100 | #59 | Exceptional 10.9% |
| Zimbabweans | 99.7 /100 | #60 | Exceptional 10.9% |
| Immigrants | Bulgaria | 99.7 /100 | #61 | Exceptional 10.9% |
| Immigrants | Northern Africa | 99.7 /100 | #62 | Exceptional 10.9% |
| Immigrants | Eritrea | 99.7 /100 | #63 | Exceptional 11.0% |
| Immigrants | Sweden | 99.6 /100 | #64 | Exceptional 11.0% |
| Bulgarians | 99.6 /100 | #65 | Exceptional 11.0% |
| Laotians | 99.6 /100 | #66 | Exceptional 11.0% |
| Colombians | 99.6 /100 | #67 | Exceptional 11.0% |
| Immigrants | Afghanistan | 99.6 /100 | #68 | Exceptional 11.0% |
| Sri Lankans | 99.5 /100 | #69 | Exceptional 11.0% |
| Immigrants | France | 99.4 /100 | #70 | Exceptional 11.0% |
| Immigrants | Lebanon | 99.4 /100 | #71 | Exceptional 11.0% |
Demographics Similar to Immigrants from Eastern Europe by Disability
In terms of disability, the demographic groups most similar to Immigrants from Eastern Europe are Nicaraguan (11.3%, a difference of 0.020%), Immigrants from Kazakhstan (11.3%, a difference of 0.030%), Immigrants from Uruguay (11.3%, a difference of 0.040%), Immigrants (11.3%, a difference of 0.040%), and Immigrants from Nigeria (11.3%, a difference of 0.10%).
| Demographics | Rating | Rank | Disability |
| Immigrants | Czechoslovakia | 97.4 /100 | #99 | Exceptional 11.2% |
| Immigrants | Greece | 96.9 /100 | #100 | Exceptional 11.3% |
| Immigrants | Nicaragua | 96.8 /100 | #101 | Exceptional 11.3% |
| Immigrants | Eastern Africa | 96.7 /100 | #102 | Exceptional 11.3% |
| Immigrants | Uruguay | 96.4 /100 | #103 | Exceptional 11.3% |
| Immigrants | Immigrants | 96.4 /100 | #104 | Exceptional 11.3% |
| Immigrants | Kazakhstan | 96.4 /100 | #105 | Exceptional 11.3% |
| Immigrants | Eastern Europe | 96.3 /100 | #106 | Exceptional 11.3% |
| Nicaraguans | 96.2 /100 | #107 | Exceptional 11.3% |
| Immigrants | Nigeria | 96.0 /100 | #108 | Exceptional 11.3% |
| Immigrants | Uganda | 95.7 /100 | #109 | Exceptional 11.3% |
| Immigrants | Denmark | 95.6 /100 | #110 | Exceptional 11.3% |
| Immigrants | South Eastern Asia | 95.4 /100 | #111 | Exceptional 11.3% |
| Immigrants | Uzbekistan | 94.9 /100 | #112 | Exceptional 11.3% |
| Guyanese | 94.7 /100 | #113 | Exceptional 11.3% |