Costa Rican vs Immigrants from Eastern Europe Disability
COMPARE
Costa Rican
Immigrants from Eastern Europe
Disability
Disability Comparison
Costa Ricans
Immigrants from Eastern Europe
11.4%
DISABILITY
91.9/ 100
METRIC RATING
125th/ 347
METRIC RANK
11.3%
DISABILITY
96.3/ 100
METRIC RATING
106th/ 347
METRIC RANK
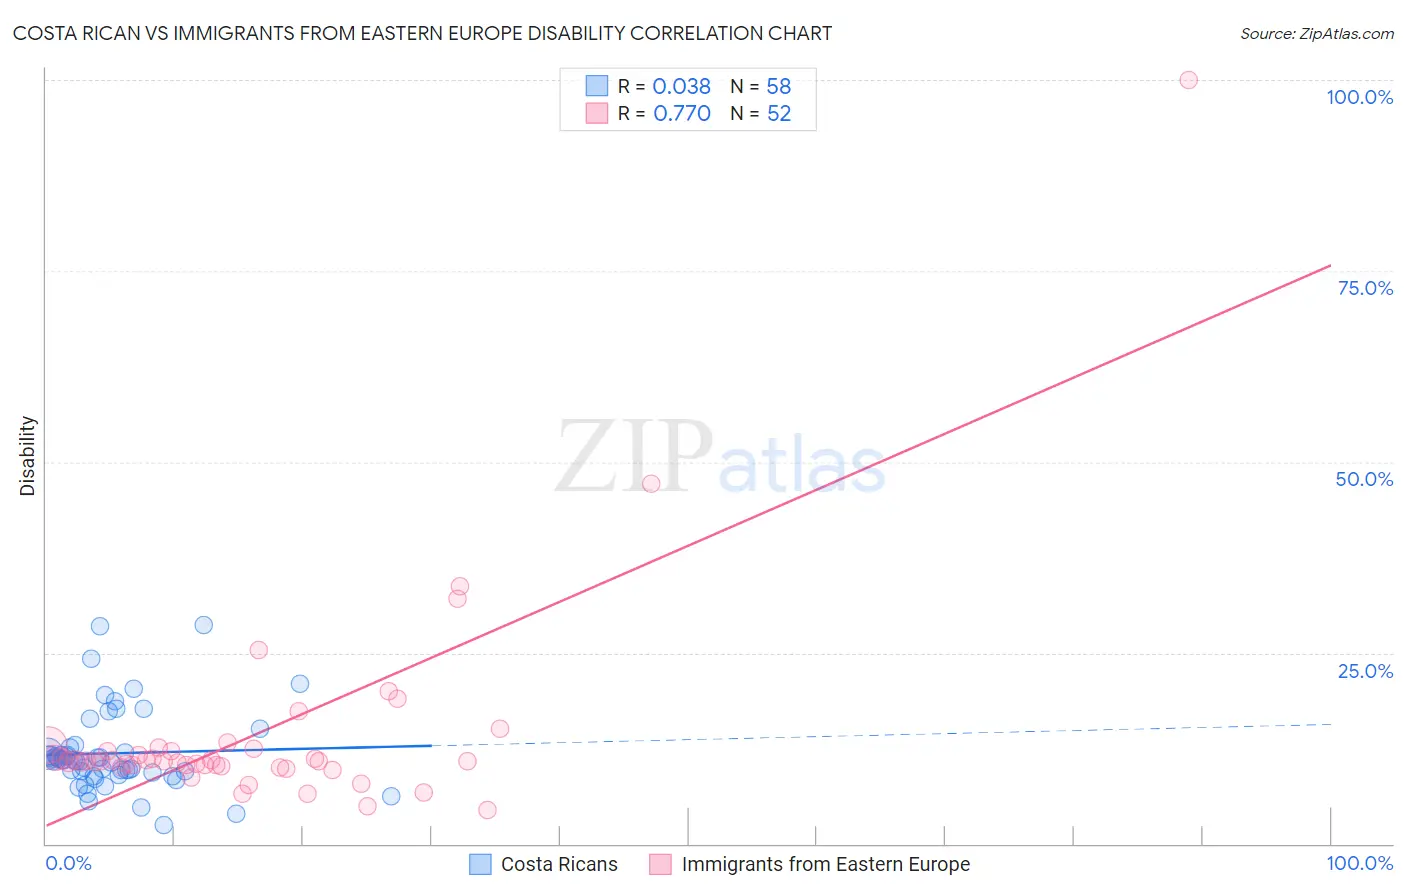
Costa Rican vs Immigrants from Eastern Europe Disability Correlation Chart
The statistical analysis conducted on geographies consisting of 253,574,017 people shows no correlation between the proportion of Costa Ricans and percentage of population with a disability in the United States with a correlation coefficient (R) of 0.038 and weighted average of 11.4%. Similarly, the statistical analysis conducted on geographies consisting of 475,819,373 people shows a strong positive correlation between the proportion of Immigrants from Eastern Europe and percentage of population with a disability in the United States with a correlation coefficient (R) of 0.770 and weighted average of 11.3%, a difference of 0.95%.
Disability Correlation Summary
| Measurement | Costa Rican | Immigrants from Eastern Europe |
| Minimum | 2.4% | 4.4% |
| Maximum | 28.6% | 100.0% |
| Range | 26.2% | 95.6% |
| Mean | 11.8% | 14.4% |
| Median | 10.9% | 10.8% |
| Interquartile 25% (IQ1) | 9.3% | 10.2% |
| Interquartile 75% (IQ3) | 12.0% | 12.3% |
| Interquartile Range (IQR) | 2.7% | 2.1% |
| Standard Deviation (Sample) | 5.2% | 14.1% |
| Standard Deviation (Population) | 5.2% | 14.0% |
Demographics Similar to Costa Ricans and Immigrants from Eastern Europe by Disability
In terms of disability, the demographic groups most similar to Costa Ricans are South American Indian (11.4%, a difference of 0.040%), South African (11.4%, a difference of 0.060%), Brazilian (11.4%, a difference of 0.23%), Immigrants from Costa Rica (11.4%, a difference of 0.26%), and Central American (11.4%, a difference of 0.27%). Similarly, the demographic groups most similar to Immigrants from Eastern Europe are Nicaraguan (11.3%, a difference of 0.020%), Immigrants from Kazakhstan (11.3%, a difference of 0.030%), Immigrants from Nigeria (11.3%, a difference of 0.10%), Immigrants from Uganda (11.3%, a difference of 0.18%), and Immigrants from Denmark (11.3%, a difference of 0.20%).
| Demographics | Rating | Rank | Disability |
| Immigrants | Kazakhstan | 96.4 /100 | #105 | Exceptional 11.3% |
| Immigrants | Eastern Europe | 96.3 /100 | #106 | Exceptional 11.3% |
| Nicaraguans | 96.2 /100 | #107 | Exceptional 11.3% |
| Immigrants | Nigeria | 96.0 /100 | #108 | Exceptional 11.3% |
| Immigrants | Uganda | 95.7 /100 | #109 | Exceptional 11.3% |
| Immigrants | Denmark | 95.6 /100 | #110 | Exceptional 11.3% |
| Immigrants | South Eastern Asia | 95.4 /100 | #111 | Exceptional 11.3% |
| Immigrants | Uzbekistan | 94.9 /100 | #112 | Exceptional 11.3% |
| Guyanese | 94.7 /100 | #113 | Exceptional 11.3% |
| Immigrants | Syria | 94.7 /100 | #114 | Exceptional 11.3% |
| Immigrants | Philippines | 94.6 /100 | #115 | Exceptional 11.3% |
| Immigrants | Northern Europe | 94.1 /100 | #116 | Exceptional 11.3% |
| Luxembourgers | 93.9 /100 | #117 | Exceptional 11.3% |
| Koreans | 93.8 /100 | #118 | Exceptional 11.3% |
| Central Americans | 93.5 /100 | #119 | Exceptional 11.4% |
| Immigrants | North Macedonia | 93.5 /100 | #120 | Exceptional 11.4% |
| Immigrants | Costa Rica | 93.4 /100 | #121 | Exceptional 11.4% |
| Brazilians | 93.3 /100 | #122 | Exceptional 11.4% |
| South Africans | 92.3 /100 | #123 | Exceptional 11.4% |
| South American Indians | 92.2 /100 | #124 | Exceptional 11.4% |
| Costa Ricans | 91.9 /100 | #125 | Exceptional 11.4% |