Native Hawaiian vs Immigrants from Eastern Europe Disability
COMPARE
Native Hawaiian
Immigrants from Eastern Europe
Disability
Disability Comparison
Native Hawaiians
Immigrants from Eastern Europe
12.5%
DISABILITY
0.3/ 100
METRIC RATING
262nd/ 347
METRIC RANK
11.3%
DISABILITY
96.3/ 100
METRIC RATING
106th/ 347
METRIC RANK
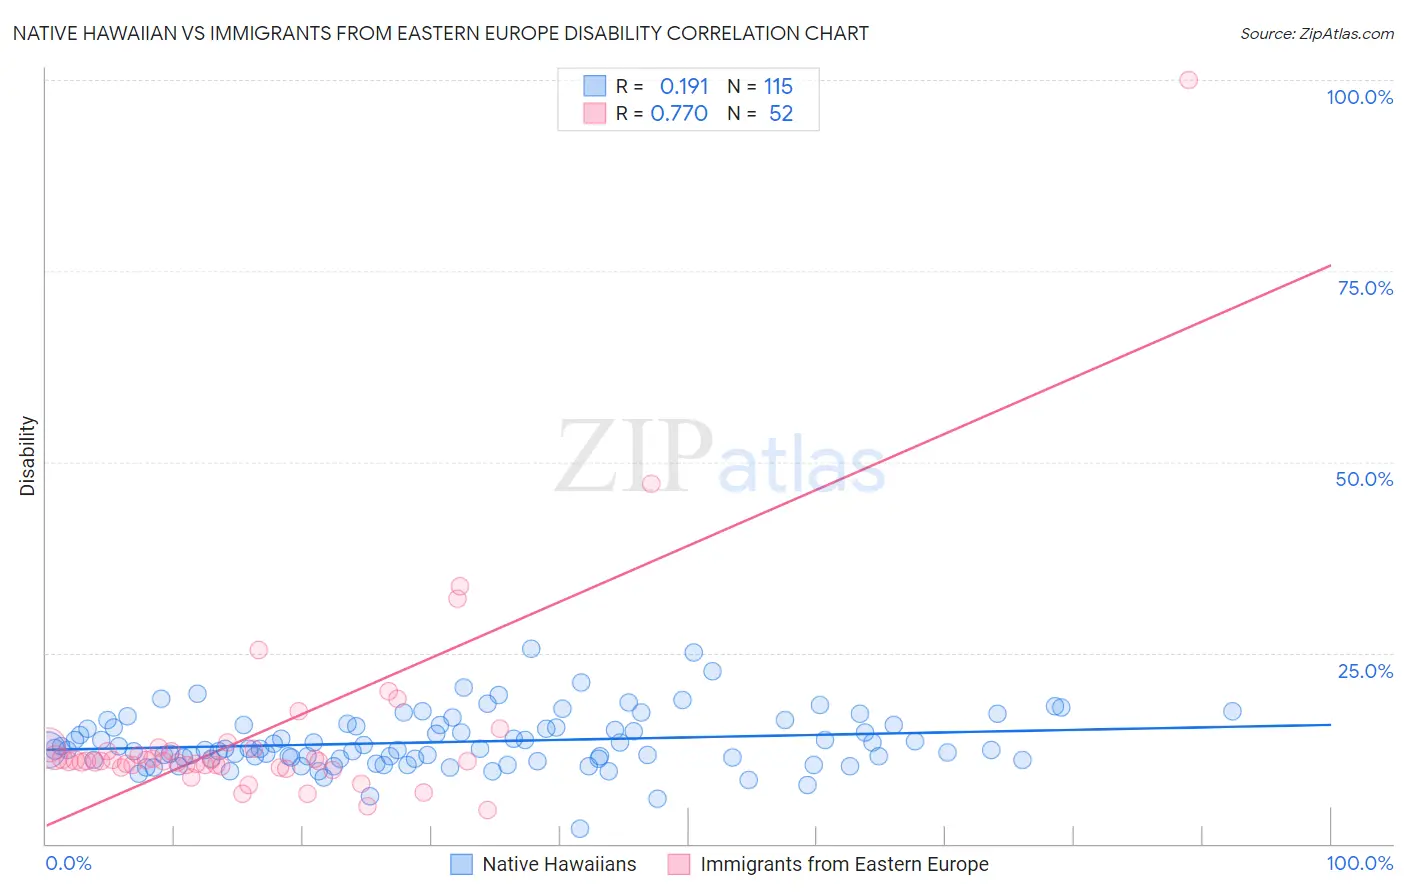
Native Hawaiian vs Immigrants from Eastern Europe Disability Correlation Chart
The statistical analysis conducted on geographies consisting of 332,036,989 people shows a poor positive correlation between the proportion of Native Hawaiians and percentage of population with a disability in the United States with a correlation coefficient (R) of 0.191 and weighted average of 12.5%. Similarly, the statistical analysis conducted on geographies consisting of 475,819,373 people shows a strong positive correlation between the proportion of Immigrants from Eastern Europe and percentage of population with a disability in the United States with a correlation coefficient (R) of 0.770 and weighted average of 11.3%, a difference of 10.4%.
Disability Correlation Summary
| Measurement | Native Hawaiian | Immigrants from Eastern Europe |
| Minimum | 2.0% | 4.4% |
| Maximum | 25.6% | 100.0% |
| Range | 23.6% | 95.6% |
| Mean | 13.3% | 14.4% |
| Median | 12.4% | 10.8% |
| Interquartile 25% (IQ1) | 11.2% | 10.2% |
| Interquartile 75% (IQ3) | 15.5% | 12.3% |
| Interquartile Range (IQR) | 4.4% | 2.1% |
| Standard Deviation (Sample) | 3.7% | 14.1% |
| Standard Deviation (Population) | 3.7% | 14.0% |
Similar Demographics by Disability
Demographics Similar to Native Hawaiians by Disability
In terms of disability, the demographic groups most similar to Native Hawaiians are Hawaiian (12.5%, a difference of 0.20%), Scandinavian (12.4%, a difference of 0.27%), Immigrants from Germany (12.5%, a difference of 0.32%), U.S. Virgin Islander (12.5%, a difference of 0.33%), and Immigrants from Liberia (12.4%, a difference of 0.34%).
| Demographics | Rating | Rank | Disability |
| Slovenes | 0.6 /100 | #255 | Tragic 12.4% |
| Immigrants | Dominica | 0.6 /100 | #256 | Tragic 12.4% |
| Immigrants | Laos | 0.5 /100 | #257 | Tragic 12.4% |
| Slavs | 0.5 /100 | #258 | Tragic 12.4% |
| Canadians | 0.4 /100 | #259 | Tragic 12.4% |
| Immigrants | Liberia | 0.4 /100 | #260 | Tragic 12.4% |
| Scandinavians | 0.4 /100 | #261 | Tragic 12.4% |
| Native Hawaiians | 0.3 /100 | #262 | Tragic 12.5% |
| Hawaiians | 0.2 /100 | #263 | Tragic 12.5% |
| Immigrants | Germany | 0.2 /100 | #264 | Tragic 12.5% |
| U.S. Virgin Islanders | 0.2 /100 | #265 | Tragic 12.5% |
| Czechoslovakians | 0.2 /100 | #266 | Tragic 12.5% |
| Spaniards | 0.2 /100 | #267 | Tragic 12.5% |
| Bangladeshis | 0.1 /100 | #268 | Tragic 12.6% |
| Immigrants | Dominican Republic | 0.1 /100 | #269 | Tragic 12.6% |
Demographics Similar to Immigrants from Eastern Europe by Disability
In terms of disability, the demographic groups most similar to Immigrants from Eastern Europe are Nicaraguan (11.3%, a difference of 0.020%), Immigrants from Kazakhstan (11.3%, a difference of 0.030%), Immigrants from Uruguay (11.3%, a difference of 0.040%), Immigrants (11.3%, a difference of 0.040%), and Immigrants from Nigeria (11.3%, a difference of 0.10%).
| Demographics | Rating | Rank | Disability |
| Immigrants | Czechoslovakia | 97.4 /100 | #99 | Exceptional 11.2% |
| Immigrants | Greece | 96.9 /100 | #100 | Exceptional 11.3% |
| Immigrants | Nicaragua | 96.8 /100 | #101 | Exceptional 11.3% |
| Immigrants | Eastern Africa | 96.7 /100 | #102 | Exceptional 11.3% |
| Immigrants | Uruguay | 96.4 /100 | #103 | Exceptional 11.3% |
| Immigrants | Immigrants | 96.4 /100 | #104 | Exceptional 11.3% |
| Immigrants | Kazakhstan | 96.4 /100 | #105 | Exceptional 11.3% |
| Immigrants | Eastern Europe | 96.3 /100 | #106 | Exceptional 11.3% |
| Nicaraguans | 96.2 /100 | #107 | Exceptional 11.3% |
| Immigrants | Nigeria | 96.0 /100 | #108 | Exceptional 11.3% |
| Immigrants | Uganda | 95.7 /100 | #109 | Exceptional 11.3% |
| Immigrants | Denmark | 95.6 /100 | #110 | Exceptional 11.3% |
| Immigrants | South Eastern Asia | 95.4 /100 | #111 | Exceptional 11.3% |
| Immigrants | Uzbekistan | 94.9 /100 | #112 | Exceptional 11.3% |
| Guyanese | 94.7 /100 | #113 | Exceptional 11.3% |