Sioux vs Cuban Child Poverty Under the Age of 5
COMPARE
Sioux
Cuban
Child Poverty Under the Age of 5
Child Poverty Under the Age of 5 Comparison
Sioux
Cubans
26.9%
CHILD POVERTY UNDER THE AGE OF 5
0.0/ 100
METRIC RATING
336th/ 347
METRIC RANK
19.1%
CHILD POVERTY UNDER THE AGE OF 5
1.7/ 100
METRIC RATING
223rd/ 347
METRIC RANK
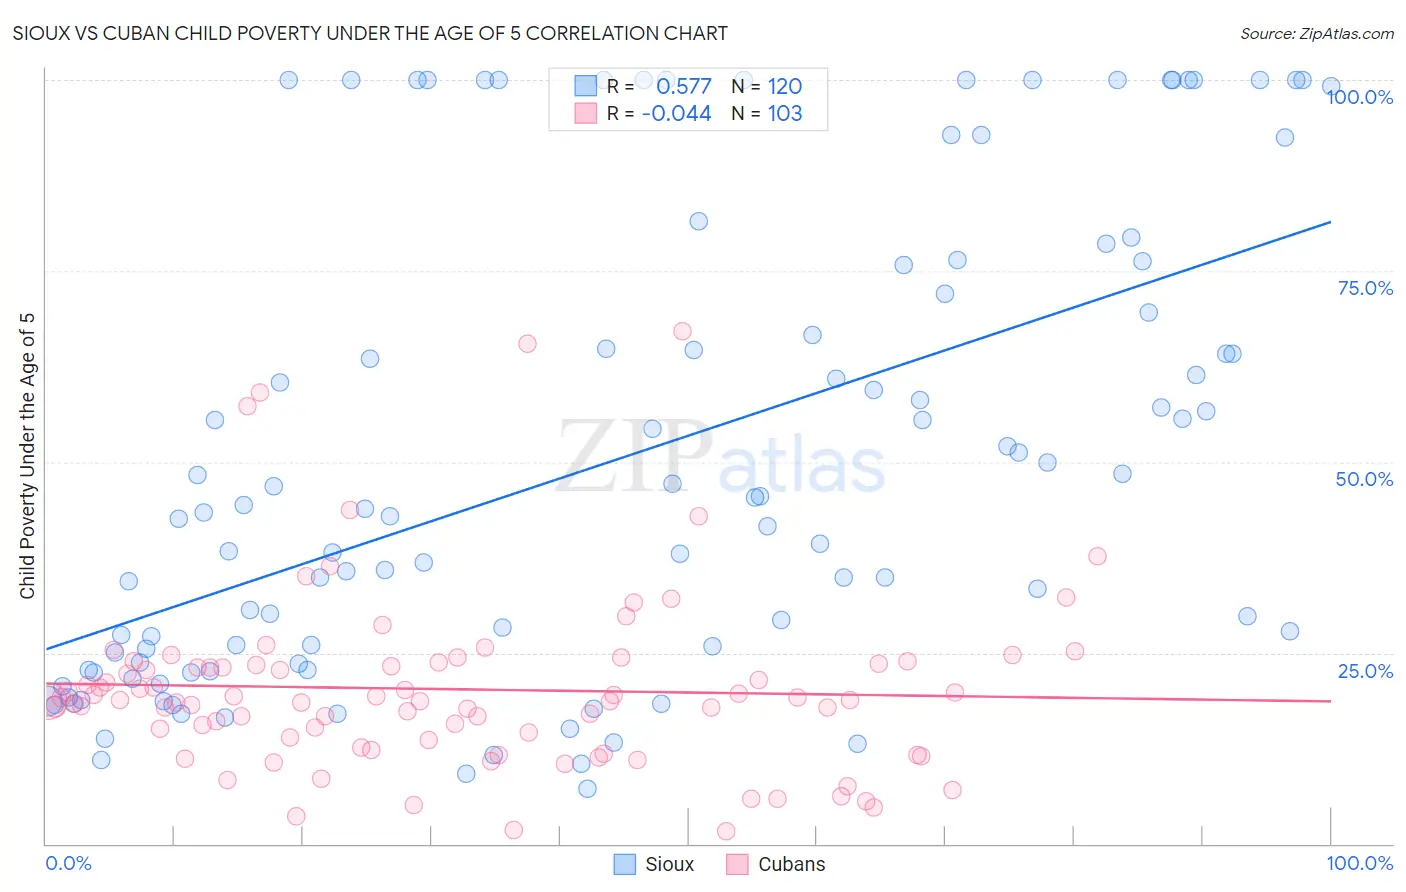
Sioux vs Cuban Child Poverty Under the Age of 5 Correlation Chart
The statistical analysis conducted on geographies consisting of 228,915,867 people shows a substantial positive correlation between the proportion of Sioux and poverty level among children under the age of 5 in the United States with a correlation coefficient (R) of 0.577 and weighted average of 26.9%. Similarly, the statistical analysis conducted on geographies consisting of 429,948,450 people shows no correlation between the proportion of Cubans and poverty level among children under the age of 5 in the United States with a correlation coefficient (R) of -0.044 and weighted average of 19.1%, a difference of 41.3%.
Child Poverty Under the Age of 5 Correlation Summary
| Measurement | Sioux | Cuban |
| Minimum | 7.1% | 1.6% |
| Maximum | 100.0% | 67.1% |
| Range | 92.9% | 65.5% |
| Mean | 50.3% | 20.2% |
| Median | 43.6% | 18.8% |
| Interquartile 25% (IQ1) | 23.7% | 13.5% |
| Interquartile 75% (IQ3) | 73.9% | 23.6% |
| Interquartile Range (IQR) | 50.3% | 10.1% |
| Standard Deviation (Sample) | 30.1% | 11.7% |
| Standard Deviation (Population) | 30.0% | 11.7% |
Similar Demographics by Child Poverty Under the Age of 5
Demographics Similar to Sioux by Child Poverty Under the Age of 5
In terms of child poverty under the age of 5, the demographic groups most similar to Sioux are Pima (27.4%, a difference of 1.9%), Hopi (27.7%, a difference of 2.9%), Yup'ik (27.7%, a difference of 3.0%), Black/African American (25.7%, a difference of 4.9%), and Colville (25.7%, a difference of 4.9%).
| Demographics | Rating | Rank | Child Poverty Under the Age of 5 |
| Cajuns | 0.0 /100 | #329 | Tragic 24.1% |
| Creek | 0.0 /100 | #330 | Tragic 24.2% |
| Kiowa | 0.0 /100 | #331 | Tragic 24.5% |
| Apache | 0.0 /100 | #332 | Tragic 25.0% |
| Natives/Alaskans | 0.0 /100 | #333 | Tragic 25.6% |
| Blacks/African Americans | 0.0 /100 | #334 | Tragic 25.7% |
| Colville | 0.0 /100 | #335 | Tragic 25.7% |
| Sioux | 0.0 /100 | #336 | Tragic 26.9% |
| Pima | 0.0 /100 | #337 | Tragic 27.4% |
| Hopi | 0.0 /100 | #338 | Tragic 27.7% |
| Yup'ik | 0.0 /100 | #339 | Tragic 27.7% |
| Cheyenne | 0.0 /100 | #340 | Tragic 28.3% |
| Immigrants | Yemen | 0.0 /100 | #341 | Tragic 29.3% |
| Tohono O'odham | 0.0 /100 | #342 | Tragic 29.5% |
| Yuman | 0.0 /100 | #343 | Tragic 29.5% |
Demographics Similar to Cubans by Child Poverty Under the Age of 5
In terms of child poverty under the age of 5, the demographic groups most similar to Cubans are Alsatian (19.1%, a difference of 0.020%), Nicaraguan (19.1%, a difference of 0.11%), Nigerian (19.1%, a difference of 0.14%), Immigrants from Eritrea (19.1%, a difference of 0.16%), and Cape Verdean (19.1%, a difference of 0.34%).
| Demographics | Rating | Rank | Child Poverty Under the Age of 5 |
| Hmong | 5.0 /100 | #216 | Tragic 18.5% |
| Immigrants | Africa | 4.6 /100 | #217 | Tragic 18.6% |
| Delaware | 3.4 /100 | #218 | Tragic 18.7% |
| German Russians | 3.0 /100 | #219 | Tragic 18.8% |
| Immigrants | Azores | 2.6 /100 | #220 | Tragic 18.9% |
| Immigrants | Nigeria | 2.1 /100 | #221 | Tragic 19.0% |
| Alsatians | 1.7 /100 | #222 | Tragic 19.1% |
| Cubans | 1.7 /100 | #223 | Tragic 19.1% |
| Nicaraguans | 1.6 /100 | #224 | Tragic 19.1% |
| Nigerians | 1.6 /100 | #225 | Tragic 19.1% |
| Immigrants | Eritrea | 1.5 /100 | #226 | Tragic 19.1% |
| Cape Verdeans | 1.4 /100 | #227 | Tragic 19.1% |
| Immigrants | Sudan | 1.3 /100 | #228 | Tragic 19.2% |
| Ghanaians | 1.2 /100 | #229 | Tragic 19.2% |
| Ecuadorians | 1.2 /100 | #230 | Tragic 19.2% |