Sioux vs Immigrants from Sudan Ambulatory Disability
COMPARE
Sioux
Immigrants from Sudan
Ambulatory Disability
Ambulatory Disability Comparison
Sioux
Immigrants from Sudan
6.7%
AMBULATORY DISABILITY
0.1/ 100
METRIC RATING
274th/ 347
METRIC RANK
5.8%
AMBULATORY DISABILITY
98.8/ 100
METRIC RATING
91st/ 347
METRIC RANK
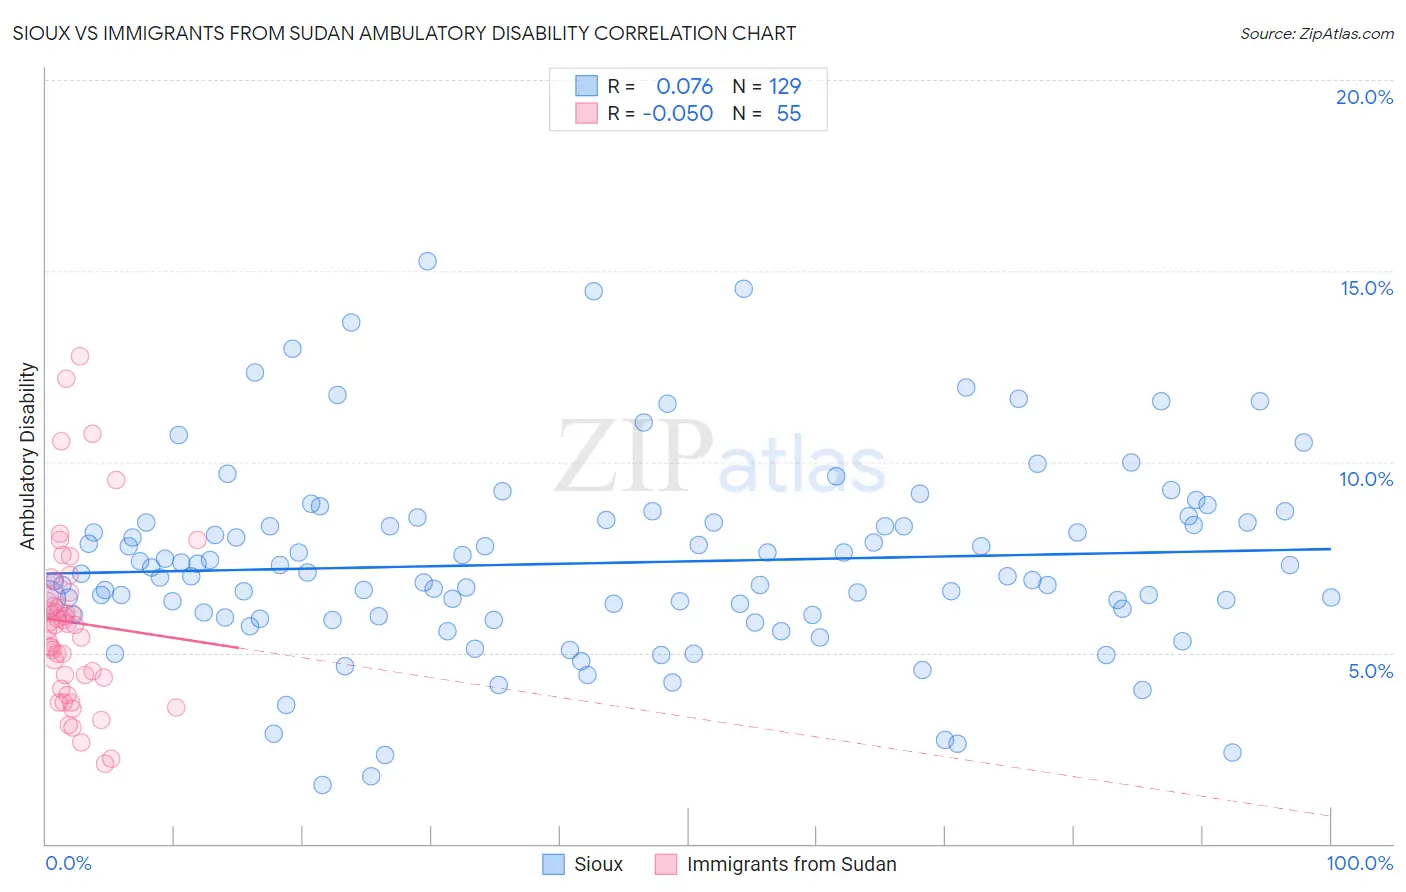
Sioux vs Immigrants from Sudan Ambulatory Disability Correlation Chart
The statistical analysis conducted on geographies consisting of 234,119,186 people shows a slight positive correlation between the proportion of Sioux and percentage of population with ambulatory disability in the United States with a correlation coefficient (R) of 0.076 and weighted average of 6.7%. Similarly, the statistical analysis conducted on geographies consisting of 118,955,409 people shows a slight negative correlation between the proportion of Immigrants from Sudan and percentage of population with ambulatory disability in the United States with a correlation coefficient (R) of -0.050 and weighted average of 5.8%, a difference of 16.4%.
Ambulatory Disability Correlation Summary
| Measurement | Sioux | Immigrants from Sudan |
| Minimum | 1.5% | 2.1% |
| Maximum | 15.2% | 12.8% |
| Range | 13.7% | 10.7% |
| Mean | 7.3% | 5.8% |
| Median | 7.0% | 5.7% |
| Interquartile 25% (IQ1) | 6.0% | 4.3% |
| Interquartile 75% (IQ3) | 8.4% | 6.6% |
| Interquartile Range (IQR) | 2.4% | 2.2% |
| Standard Deviation (Sample) | 2.5% | 2.3% |
| Standard Deviation (Population) | 2.5% | 2.2% |
Similar Demographics by Ambulatory Disability
Demographics Similar to Sioux by Ambulatory Disability
In terms of ambulatory disability, the demographic groups most similar to Sioux are Immigrants from Guyana (6.7%, a difference of 0.060%), Celtic (6.7%, a difference of 0.090%), Jamaican (6.7%, a difference of 0.17%), White/Caucasian (6.7%, a difference of 0.24%), and Immigrants from West Indies (6.7%, a difference of 0.25%).
| Demographics | Rating | Rank | Ambulatory Disability |
| Trinidadians and Tobagonians | 0.2 /100 | #267 | Tragic 6.6% |
| Spanish | 0.2 /100 | #268 | Tragic 6.6% |
| French | 0.1 /100 | #269 | Tragic 6.6% |
| Slovaks | 0.1 /100 | #270 | Tragic 6.7% |
| Immigrants | Trinidad and Tobago | 0.1 /100 | #271 | Tragic 6.7% |
| French Canadians | 0.1 /100 | #272 | Tragic 6.7% |
| Whites/Caucasians | 0.1 /100 | #273 | Tragic 6.7% |
| Sioux | 0.1 /100 | #274 | Tragic 6.7% |
| Immigrants | Guyana | 0.1 /100 | #275 | Tragic 6.7% |
| Celtics | 0.1 /100 | #276 | Tragic 6.7% |
| Jamaicans | 0.1 /100 | #277 | Tragic 6.7% |
| Immigrants | West Indies | 0.1 /100 | #278 | Tragic 6.7% |
| Immigrants | Caribbean | 0.0 /100 | #279 | Tragic 6.7% |
| Pennsylvania Germans | 0.0 /100 | #280 | Tragic 6.8% |
| Yaqui | 0.0 /100 | #281 | Tragic 6.8% |
Demographics Similar to Immigrants from Sudan by Ambulatory Disability
In terms of ambulatory disability, the demographic groups most similar to Immigrants from Sudan are Bhutanese (5.8%, a difference of 0.0%), Australian (5.8%, a difference of 0.0%), Soviet Union (5.8%, a difference of 0.12%), Immigrants from Chile (5.8%, a difference of 0.17%), and Immigrants from Sierra Leone (5.8%, a difference of 0.17%).
| Demographics | Rating | Rank | Ambulatory Disability |
| Ugandans | 99.2 /100 | #84 | Exceptional 5.7% |
| South Americans | 99.0 /100 | #85 | Exceptional 5.7% |
| Latvians | 99.0 /100 | #86 | Exceptional 5.7% |
| Immigrants | Chile | 98.9 /100 | #87 | Exceptional 5.8% |
| Soviet Union | 98.9 /100 | #88 | Exceptional 5.8% |
| Bhutanese | 98.8 /100 | #89 | Exceptional 5.8% |
| Australians | 98.8 /100 | #90 | Exceptional 5.8% |
| Immigrants | Sudan | 98.8 /100 | #91 | Exceptional 5.8% |
| Immigrants | Sierra Leone | 98.6 /100 | #92 | Exceptional 5.8% |
| Immigrants | Denmark | 98.6 /100 | #93 | Exceptional 5.8% |
| Kenyans | 98.4 /100 | #94 | Exceptional 5.8% |
| Immigrants | El Salvador | 98.4 /100 | #95 | Exceptional 5.8% |
| Salvadorans | 98.4 /100 | #96 | Exceptional 5.8% |
| Immigrants | Somalia | 98.3 /100 | #97 | Exceptional 5.8% |
| Immigrants | Lebanon | 98.3 /100 | #98 | Exceptional 5.8% |